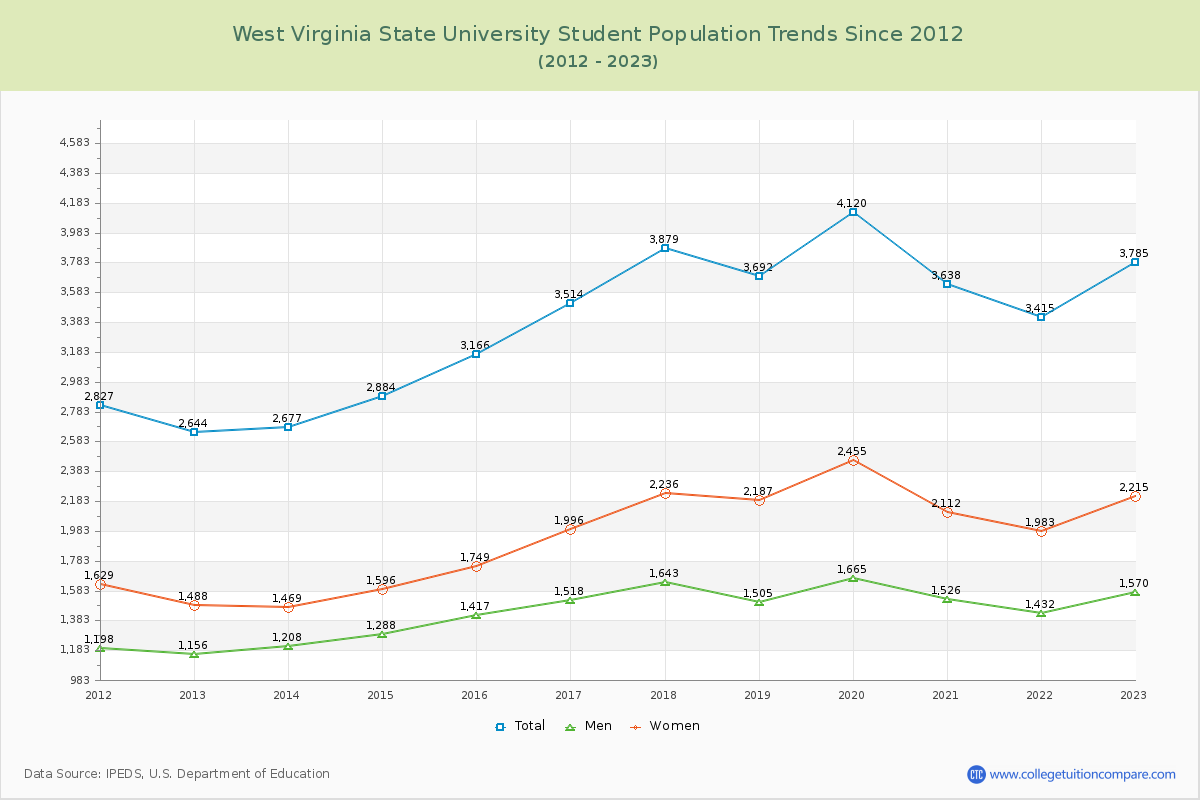
Student Population Changes
The average student population over the last 12 years is 3,401 where 3,785 students are attending the school for the academic year 2022-2023.
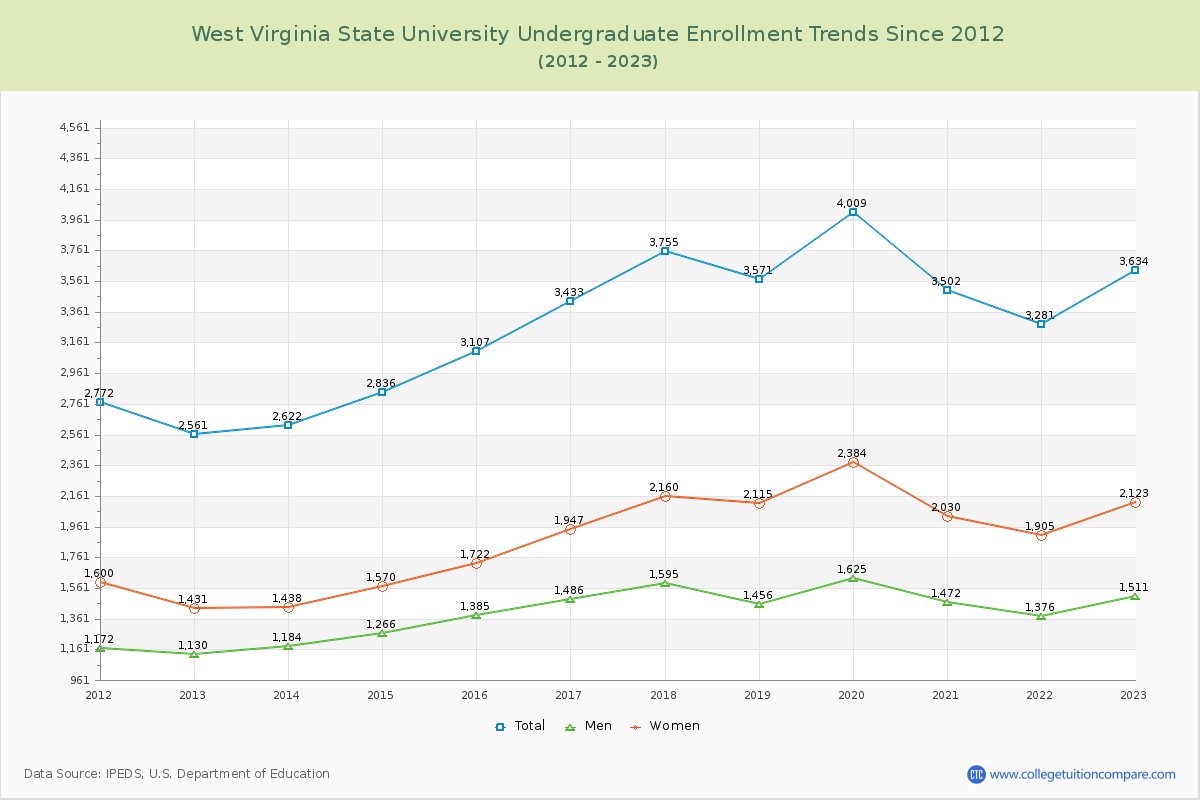
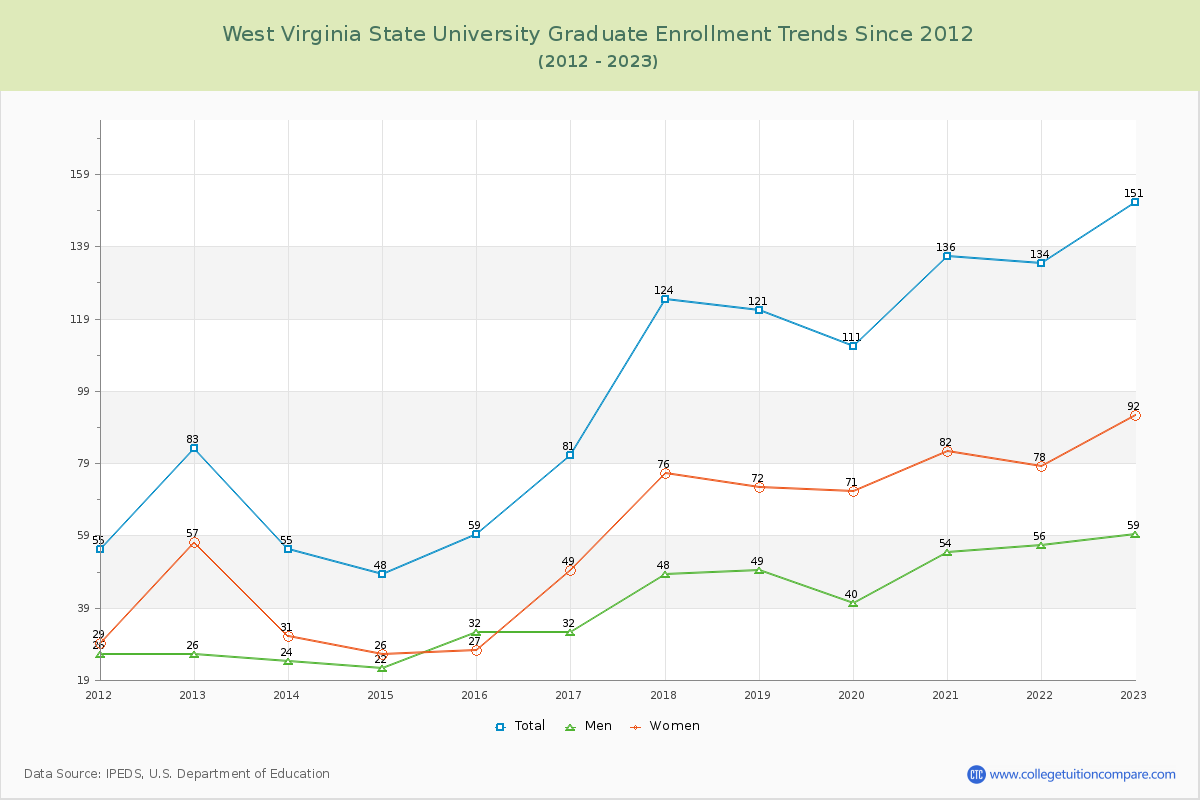
96.01% of total students is undergraduate students and 3.99% students is graduate students. The number of undergraduate students has increased by 1,073 and the graduate enrollment has increased by 68 over past 10 years.
The female to male ratio is 1.41 to 1 and it means that there are more female students enrolled in WVSU than male students.
The following table and chart illustrate the changes in student population by gender at West Virginia State University since 2012.
| Year | Total | Undergraduate | Graduate | ||||
|---|---|---|---|---|---|---|---|
| Total | Men | Women | Total | Men | Women | ||
| 2012-13 | 2,644 | 2,561 | 1,130 | 1,431 | 83 | 26 | 57 |
| 2013-14 | 2,677 33 | 2,622 61 | 1,184 54 | 1,438 7 | 55 -28 | 24 -2 | 31 -26 |
| 2014-15 | 2,884 207 | 2,836 214 | 1,266 82 | 1,570 132 | 48 -7 | 22 -2 | 26 -5 |
| 2015-16 | 3,166 282 | 3,107 271 | 1,385 119 | 1,722 152 | 59 11 | 32 10 | 27 1 |
| 2016-17 | 3,514 348 | 3,433 326 | 1,486 101 | 1,947 225 | 81 22 | 32 0 | 49 22 |
| 2017-18 | 3,879 365 | 3,755 322 | 1,595 109 | 2,160 213 | 124 43 | 48 16 | 76 27 |
| 2018-19 | 3,692 -187 | 3,571 -184 | 1,456 -139 | 2,115 -45 | 121 -3 | 49 1 | 72 -4 |
| 2019-20 | 4,120 428 | 4,009 438 | 1,625 169 | 2,384 269 | 111 -10 | 40 -9 | 71 -1 |
| 2020-21 | 3,638 -482 | 3,502 -507 | 1,472 -153 | 2,030 -354 | 136 25 | 54 14 | 82 11 |
| 2021-22 | 3,415 -223 | 3,281 -221 | 1,376 -96 | 1,905 -125 | 134 -2 | 56 2 | 78 -4 |
| 2022-23 | 3,785 370 | 3,634 353 | 1,511 135 | 2,123 218 | 151 17 | 59 3 | 92 14 |
| Average | 3,401 | 3,301 | 1,408 | 1,893 | 100 | 40 | 60 |