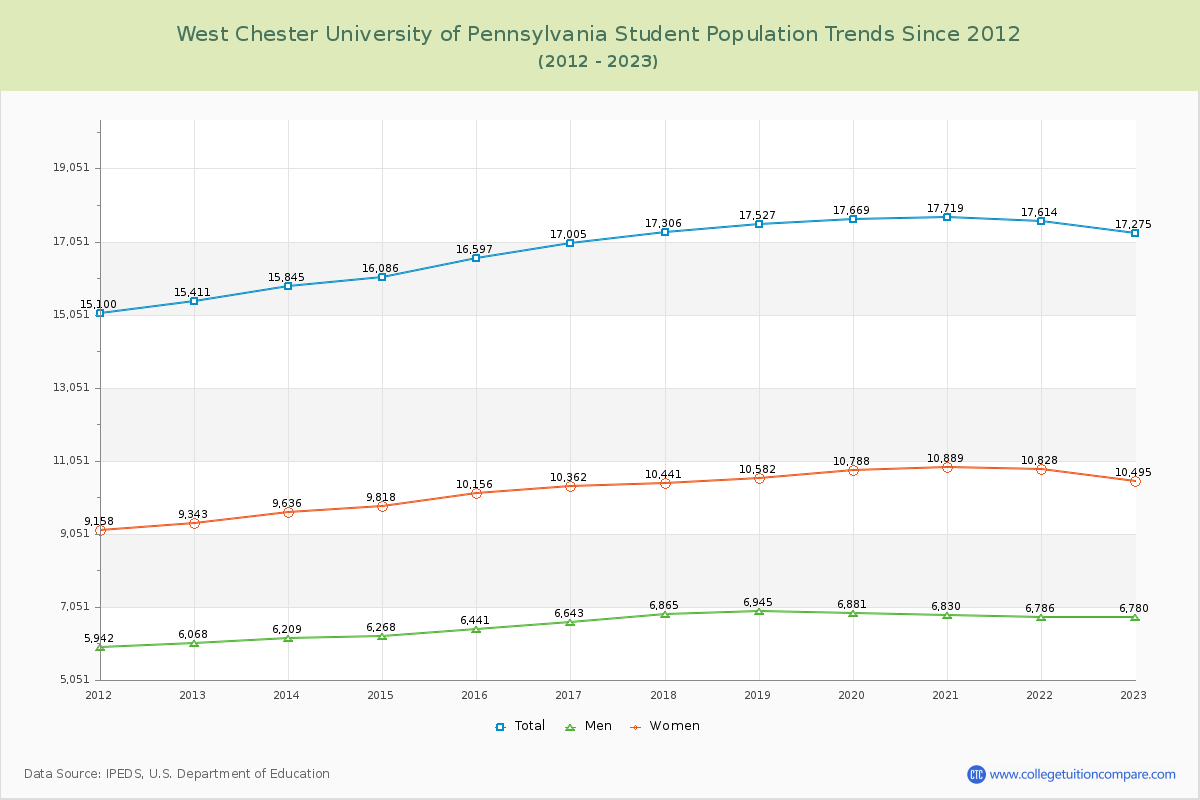
Student Population Changes
The average student population over the last 12 years is 16,914 where 17,275 students are attending the school for the academic year 2022-2023.
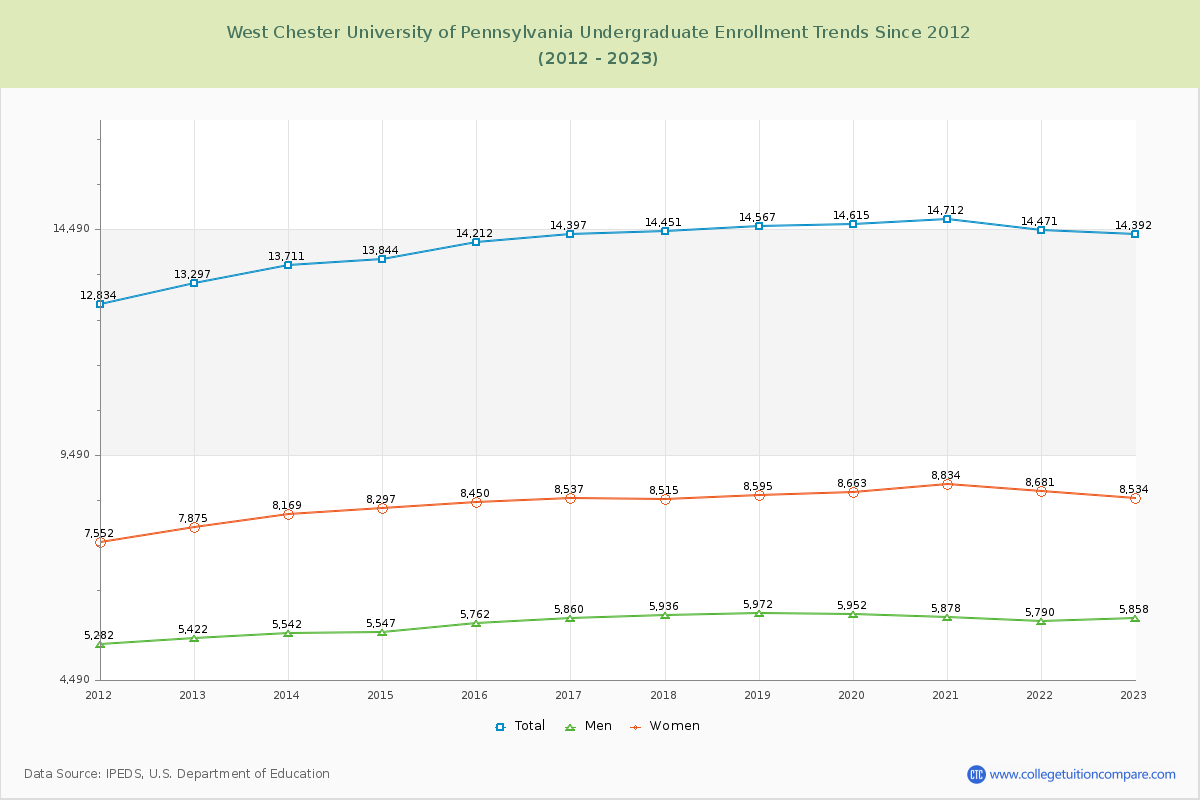
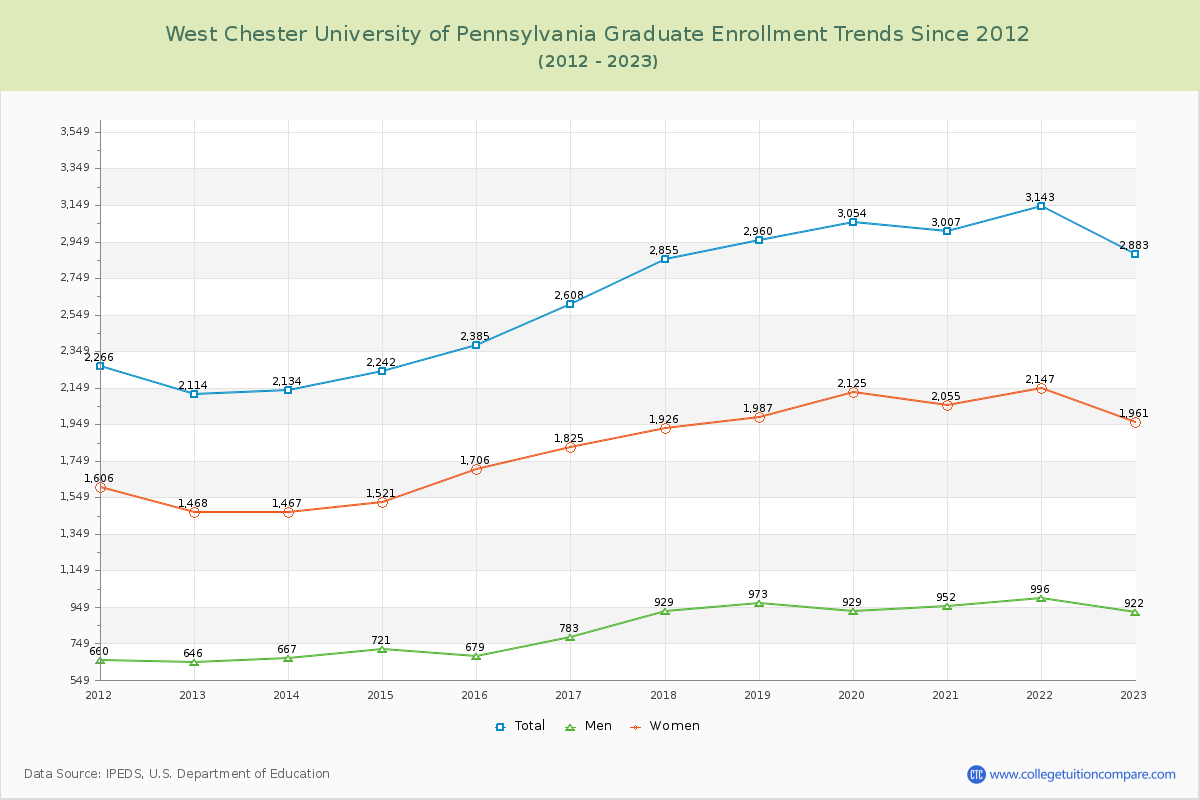
83.31% of total students is undergraduate students and 16.69% students is graduate students. The number of undergraduate students has increased by 1,095 and the graduate enrollment has increased by 769 over past 10 years.
The female to male ratio is 1.55 to 1 and it means that there are more female students enrolled in WCU than male students.
The following table and chart illustrate the changes in student population by gender at West Chester University of Pennsylvania since 2012.
| Year | Total | Undergraduate | Graduate | ||||
|---|---|---|---|---|---|---|---|
| Total | Men | Women | Total | Men | Women | ||
| 2012-13 | 15,411 | 13,297 | 5,422 | 7,875 | 2,114 | 646 | 1,468 |
| 2013-14 | 15,845 434 | 13,711 414 | 5,542 120 | 8,169 294 | 2,134 20 | 667 21 | 1,467 -1 |
| 2014-15 | 16,086 241 | 13,844 133 | 5,547 5 | 8,297 128 | 2,242 108 | 721 54 | 1,521 54 |
| 2015-16 | 16,597 511 | 14,212 368 | 5,762 215 | 8,450 153 | 2,385 143 | 679 -42 | 1,706 185 |
| 2016-17 | 17,005 408 | 14,397 185 | 5,860 98 | 8,537 87 | 2,608 223 | 783 104 | 1,825 119 |
| 2017-18 | 17,306 301 | 14,451 54 | 5,936 76 | 8,515 -22 | 2,855 247 | 929 146 | 1,926 101 |
| 2018-19 | 17,527 221 | 14,567 116 | 5,972 36 | 8,595 80 | 2,960 105 | 973 44 | 1,987 61 |
| 2019-20 | 17,669 142 | 14,615 48 | 5,952 -20 | 8,663 68 | 3,054 94 | 929 -44 | 2,125 138 |
| 2020-21 | 17,719 50 | 14,712 97 | 5,878 -74 | 8,834 171 | 3,007 -47 | 952 23 | 2,055 -70 |
| 2021-22 | 17,614 -105 | 14,471 -241 | 5,790 -88 | 8,681 -153 | 3,143 136 | 996 44 | 2,147 92 |
| 2022-23 | 17,275 -339 | 14,392 -79 | 5,858 68 | 8,534 -147 | 2,883 -260 | 922 -74 | 1,961 -186 |
| Average | 16,914 | 14,243 | 5,774 | 8,468 | 2,671 | 836 | 1,835 |