Graduation Rate Changes

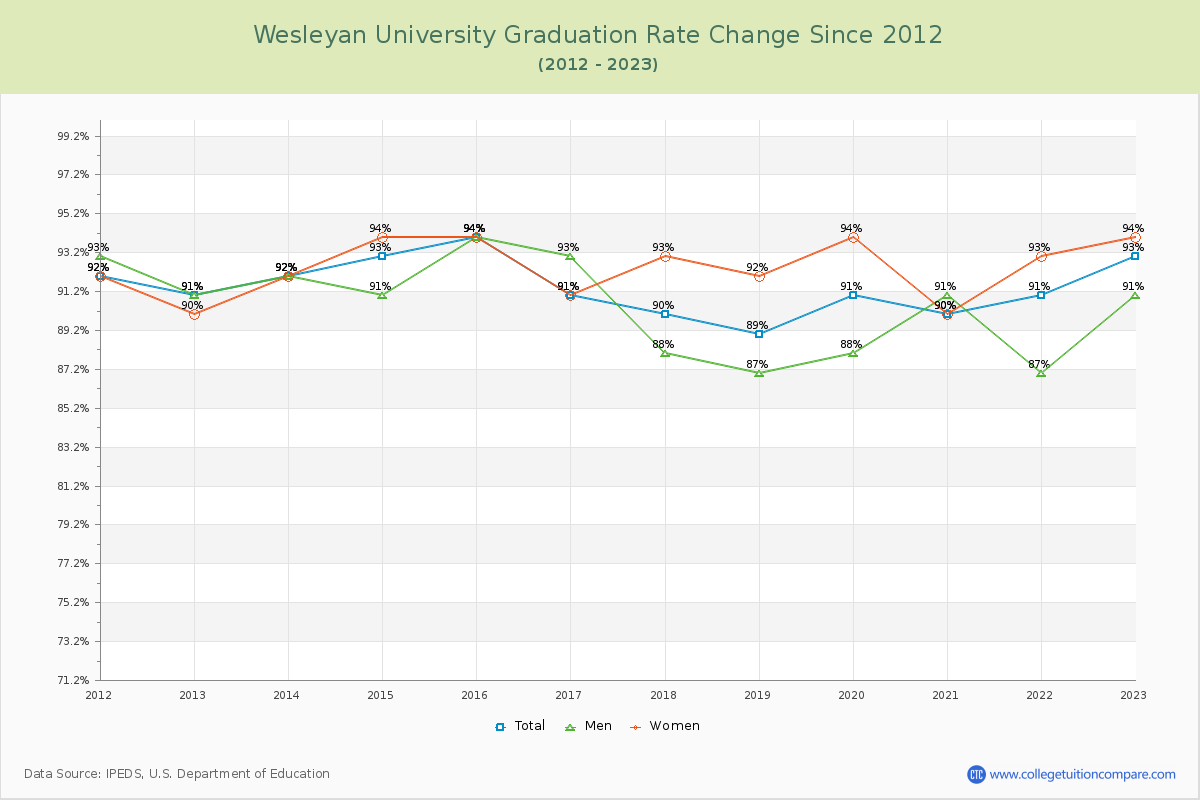
The average graduation rate of the last 12 years is 91.36% where the current academic year rate is 93%.
The following table and chart show the changes of graduation rate at Wesleyan University over the past 12 years (2012-2023).
TableInteractive ChartDownloadable Chart
YearTotalMenWomen
2012-13 91%91%90%
2013-14 92%92%92%
2014-15 93%91%94%
2015-16 94%94%94%
2016-17 91%93%91%
2017-18 90%88%93%
2018-19 89%87%92%
2019-20 91%88%94%
2020-21 90%91%90%
2021-22 91%87%93%
2022-23 93%91%94%
Average91.36%90.27%92.45%
Graduation Rate Changes of Wesleyan University
Wesleyan University Graduation Rate Changes Chart

Transfer-out Rate Changes

The average transfer-out rate of the last 12 years is 2.55% where the current year rate is 4%. The following table and chart illustrate the change of transfer-out rate at Wesleyan University from 2018 to 2023.
TableChart
YearTransfer-out Rate
2018-197%
2019-206%
2020-216%
2021-225%
2022-234%
Average2.55%
Transfer-out Rate Changes of Wesleyan University

Retention Rate Changes

The average retention rate of the last 12 years is 94.55% (all full-time students).
The following table shows the changes of retention rate at Wesleyan from 2012 to 2023.
TableChart
YearFull-timePart-time
2012-1395%-
2013-1495%-
2014-1596%-
2015-1695%-
2016-1794%-
2017-1895%-
2018-1996%-
2019-2097%-
2020-2187%-
2021-2295%-
2022-2395%-
Average94.55%-
Retention Rate Changes of Wesleyan University

Student to Faculty Ratio Changes

The average student to faculty ratio over the last 12 years is 8.09 to 1 where the current academic year ratio is 7 to 1. The following table and chart illustrate the change of student to faculty ratio at Wesleyan University since 2023.
TableChart
YearStudent to Faculty Ratio
2012-139:1
2013-149:1
2014-158:1
2015-168:1
2016-178:1
2017-188:1
2018-198:1
2019-208:1
2020-218:1
2021-228:1
2022-237:1
Average8.09:1
Student to Faculty Ratio Changes of Wesleyan University
Related Articles and Ads