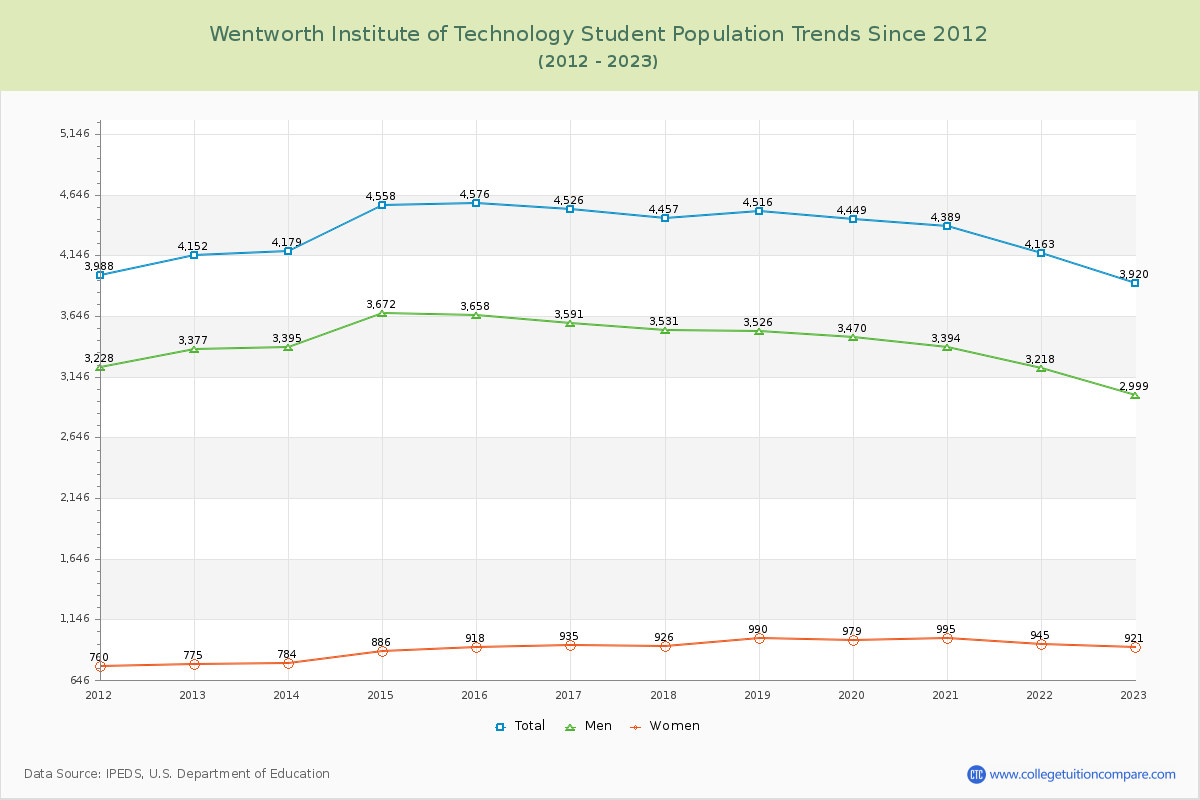
Student Population Changes
The average student population over the last 12 years is 4,353 where 3,920 students are attending the school for the academic year 2022-2023.
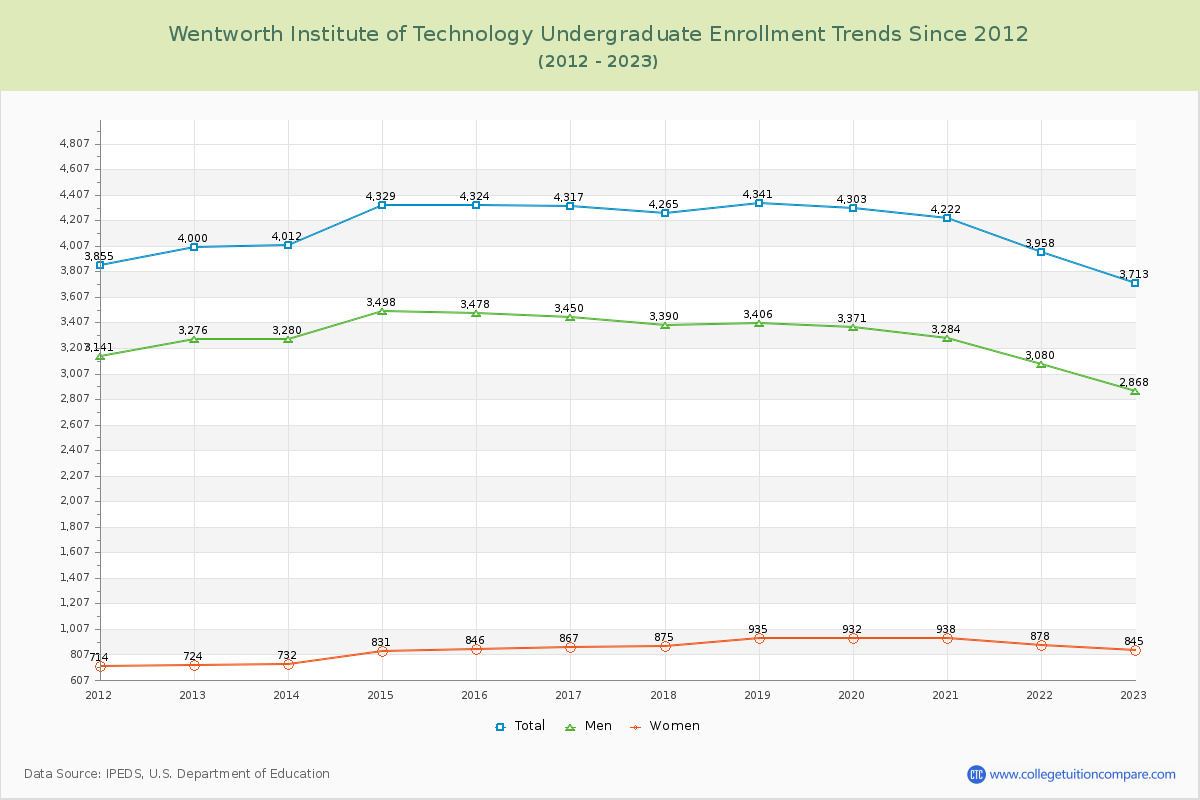
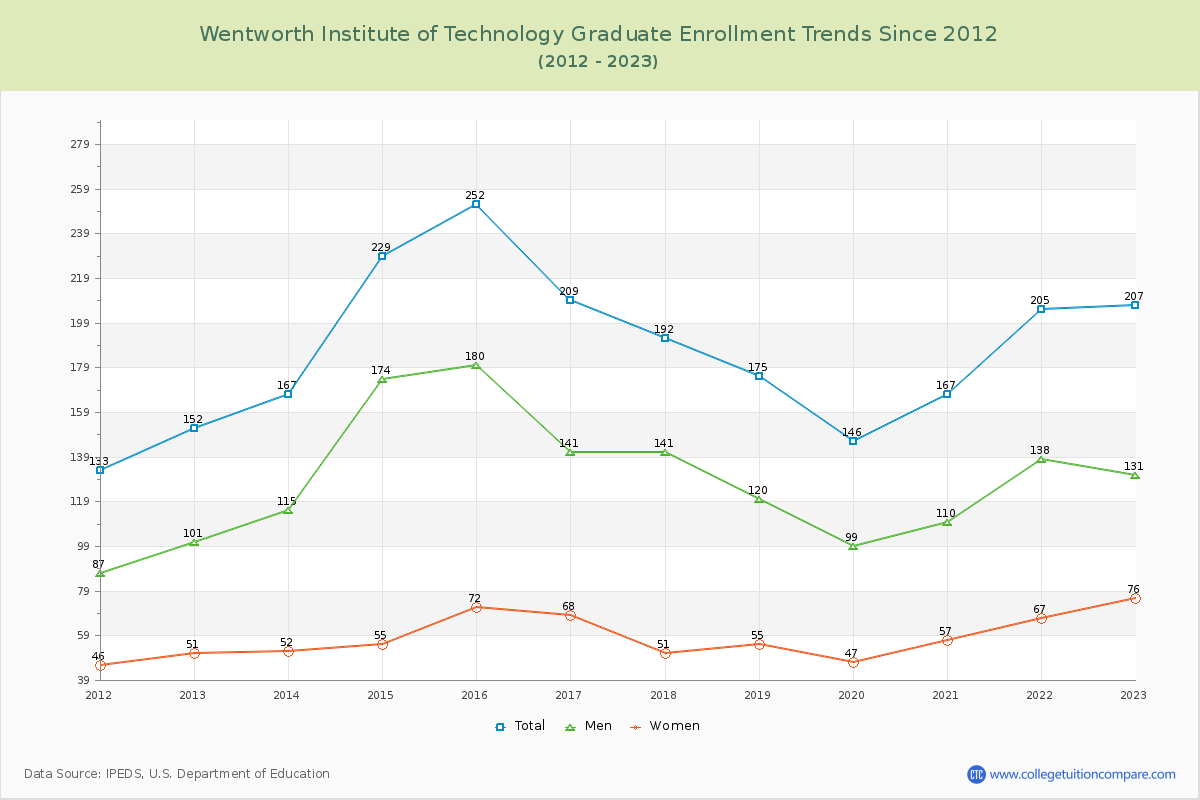
94.72% of total students is undergraduate students and 5.28% students is graduate students. The number of undergraduate students has decreased by 287 and the graduate enrollment has increased by 55 over past 10 years.
The female to male ratio is 0.31 to 1 and it means that there are far more male students enrolled in Wentworth Institute of Technology than female students.
The following table and chart illustrate the changes in student population by gender at Wentworth Institute of Technology since 2012.
| Year | Total | Undergraduate | Graduate | ||||
|---|---|---|---|---|---|---|---|
| Total | Men | Women | Total | Men | Women | ||
| 2012-13 | 4,152 | 4,000 | 3,276 | 724 | 152 | 101 | 51 |
| 2013-14 | 4,179 27 | 4,012 12 | 3,280 4 | 732 8 | 167 15 | 115 14 | 52 1 |
| 2014-15 | 4,558 379 | 4,329 317 | 3,498 218 | 831 99 | 229 62 | 174 59 | 55 3 |
| 2015-16 | 4,576 18 | 4,324 -5 | 3,478 -20 | 846 15 | 252 23 | 180 6 | 72 17 |
| 2016-17 | 4,526 -50 | 4,317 -7 | 3,450 -28 | 867 21 | 209 -43 | 141 -39 | 68 -4 |
| 2017-18 | 4,457 -69 | 4,265 -52 | 3,390 -60 | 875 8 | 192 -17 | 141 0 | 51 -17 |
| 2018-19 | 4,516 59 | 4,341 76 | 3,406 16 | 935 60 | 175 -17 | 120 -21 | 55 4 |
| 2019-20 | 4,449 -67 | 4,303 -38 | 3,371 -35 | 932 -3 | 146 -29 | 99 -21 | 47 -8 |
| 2020-21 | 4,389 -60 | 4,222 -81 | 3,284 -87 | 938 6 | 167 21 | 110 11 | 57 10 |
| 2021-22 | 4,163 -226 | 3,958 -264 | 3,080 -204 | 878 -60 | 205 38 | 138 28 | 67 10 |
| 2022-23 | 3,920 -243 | 3,713 -245 | 2,868 -212 | 845 -33 | 207 2 | 131 -7 | 76 9 |
| Average | 4,353 | 4,162 | 3,307 | 855 | 191 | 132 | 59 |