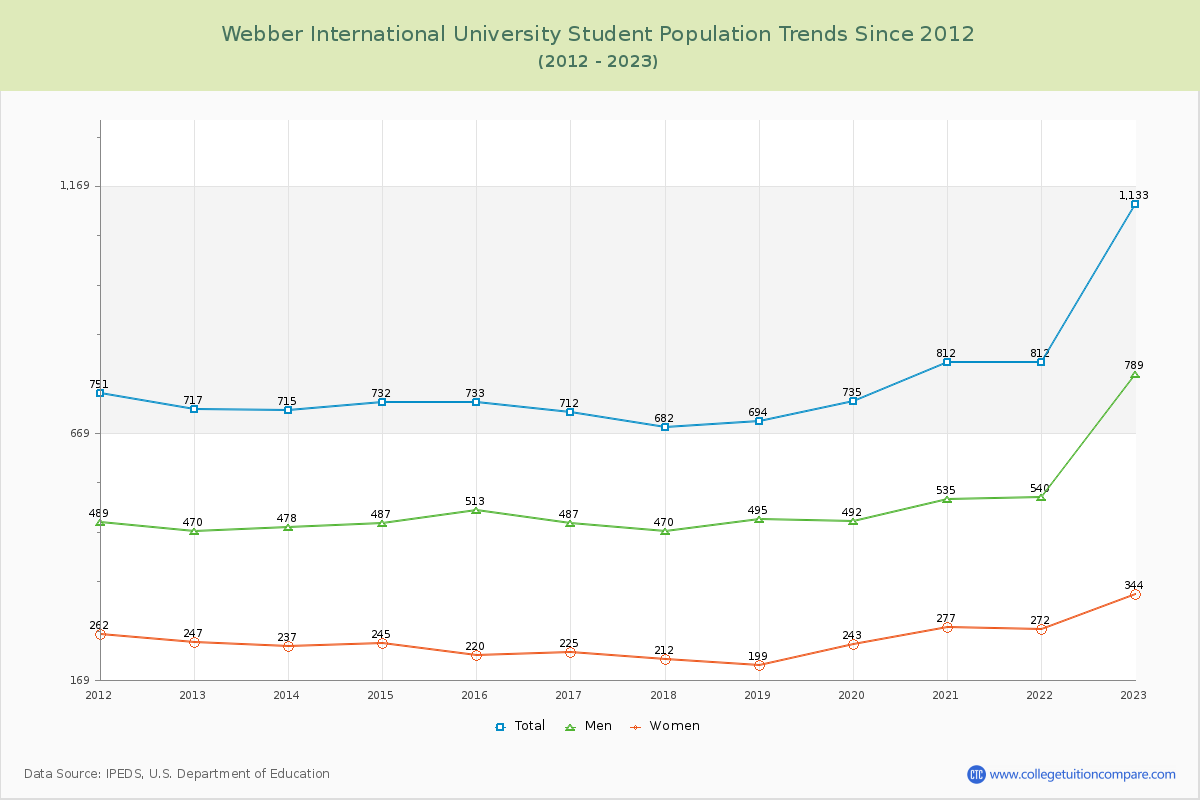
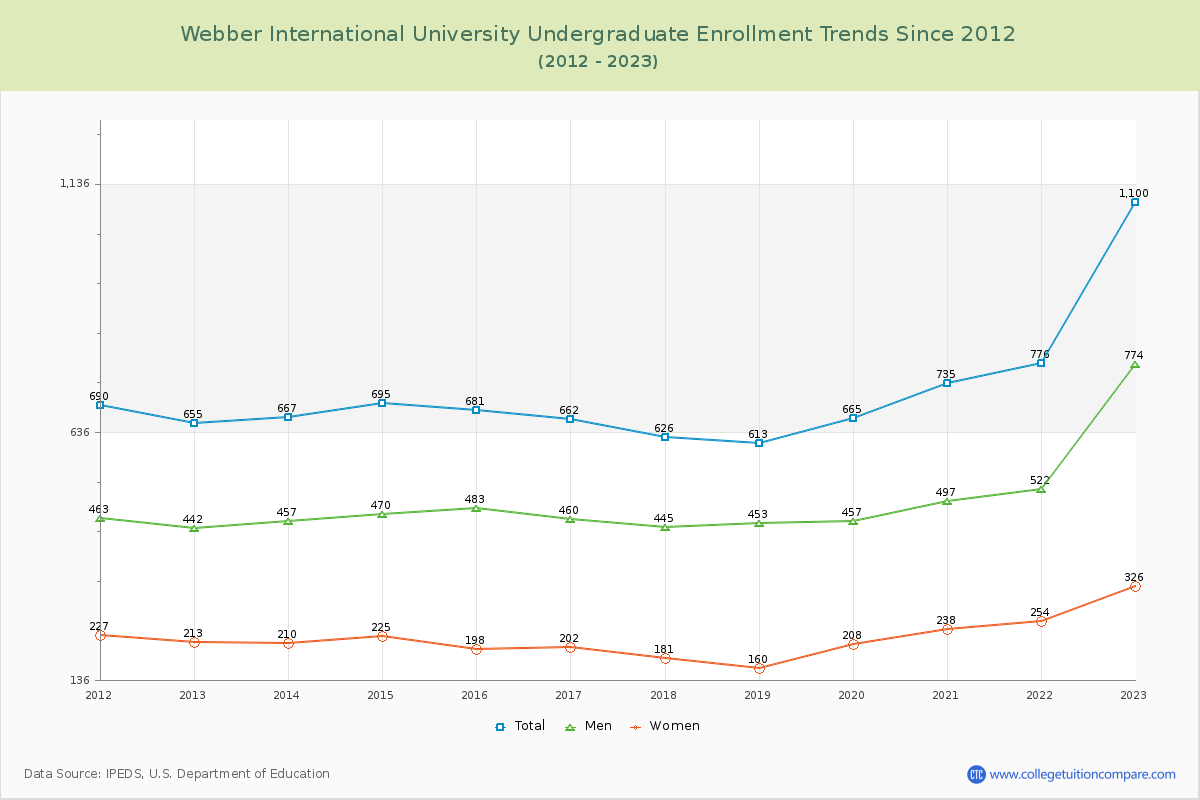
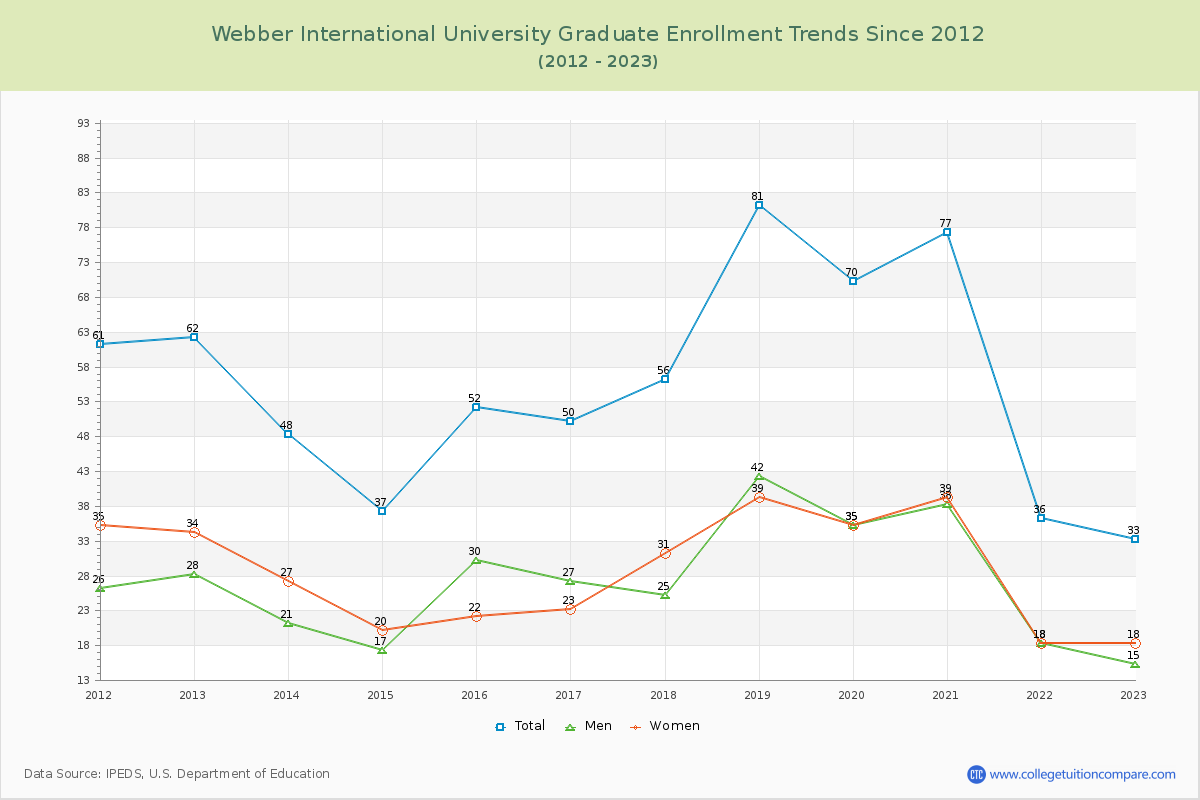
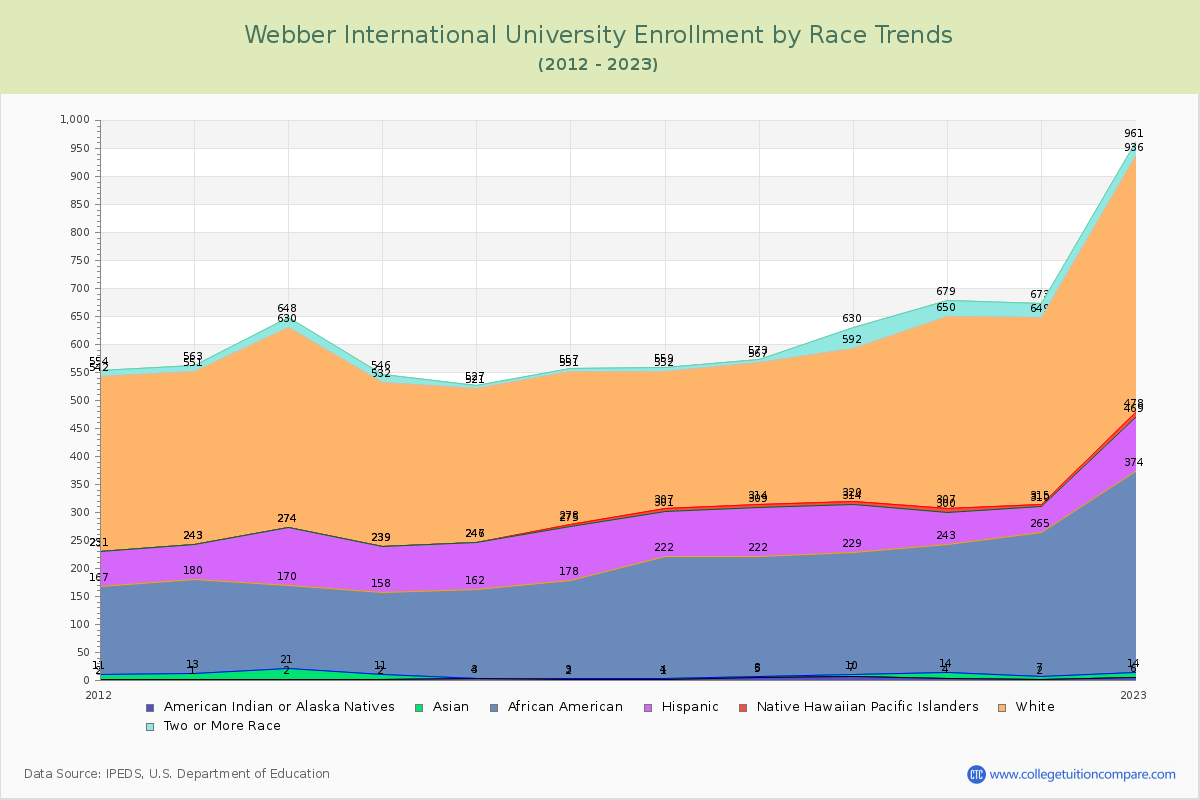
Student Population Changes
The average student population over the last 12 years is 771 where 1,133 students are attending the school for the academic year 2022-2023.
97.09% of total students is undergraduate students and 2.91% students is graduate students. The number of undergraduate students has increased by 445 and the graduate enrollment has decreased by 29 over past 10 years.
The female to male ratio is 0.44 to 1 and it means that there are far more male students enrolled in Webber International than female students.
The following table and chart illustrate the changes in student population by gender at Webber International University since 2012.
| Year | Total | Undergraduate | Graduate | ||||
|---|---|---|---|---|---|---|---|
| Total | Men | Women | Total | Men | Women | ||
| 2012-13 | 717 | 655 | 442 | 213 | 62 | 28 | 34 |
| 2013-14 | 715 -2 | 667 12 | 457 15 | 210 -3 | 48 -14 | 21 -7 | 27 -7 |
| 2014-15 | 732 17 | 695 28 | 470 13 | 225 15 | 37 -11 | 17 -4 | 20 -7 |
| 2015-16 | 733 1 | 681 -14 | 483 13 | 198 -27 | 52 15 | 30 13 | 22 2 |
| 2016-17 | 712 -21 | 662 -19 | 460 -23 | 202 4 | 50 -2 | 27 -3 | 23 1 |
| 2017-18 | 682 -30 | 626 -36 | 445 -15 | 181 -21 | 56 6 | 25 -2 | 31 8 |
| 2018-19 | 694 12 | 613 -13 | 453 8 | 160 -21 | 81 25 | 42 17 | 39 8 |
| 2019-20 | 735 41 | 665 52 | 457 4 | 208 48 | 70 -11 | 35 -7 | 35 -4 |
| 2020-21 | 812 77 | 735 70 | 497 40 | 238 30 | 77 7 | 38 3 | 39 4 |
| 2021-22 | 812 0 | 776 41 | 522 25 | 254 16 | 36 -41 | 18 -20 | 18 -21 |
| 2022-23 | 1,133 321 | 1,100 324 | 774 252 | 326 72 | 33 -3 | 15 -3 | 18 0 |
| Average | 771 | 716 | 496 | 220 | 55 | 27 | 28 |