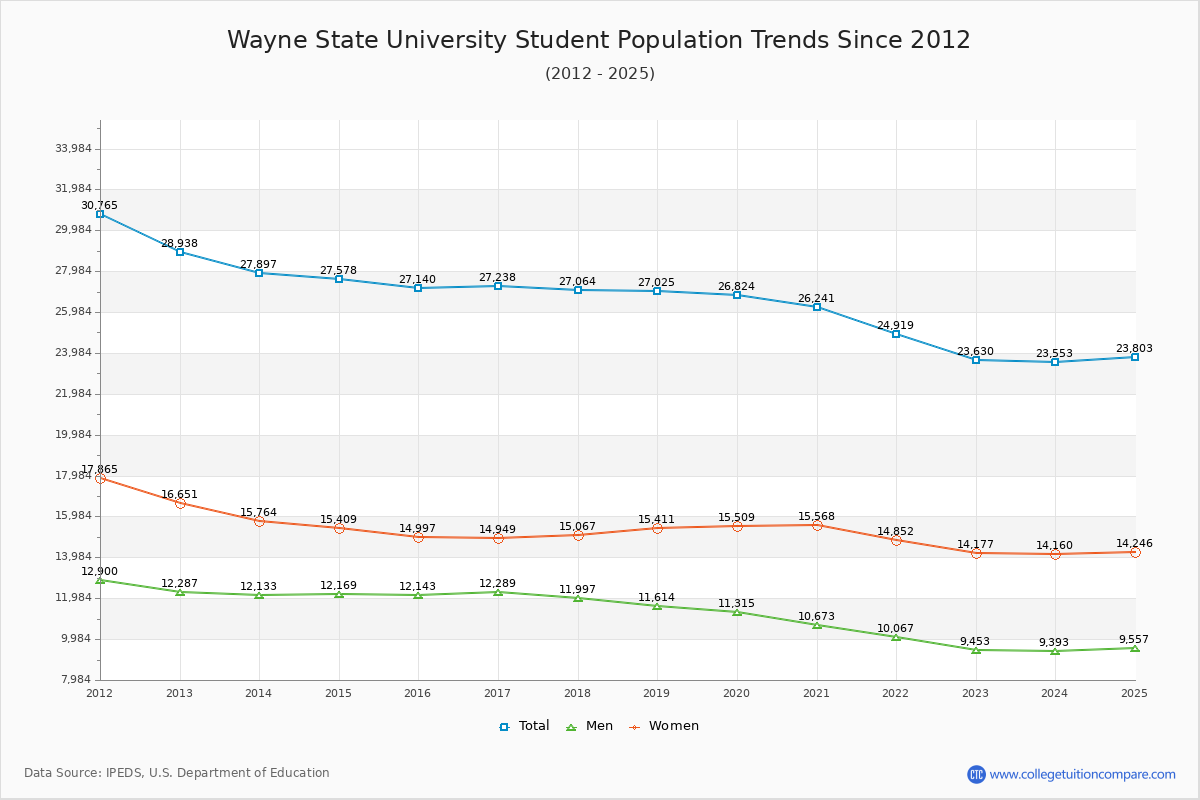
Student Population Changes
The average student population over the last 12 years is 26,772 where 23,630 students are attending the school for the academic year 2022-2023.
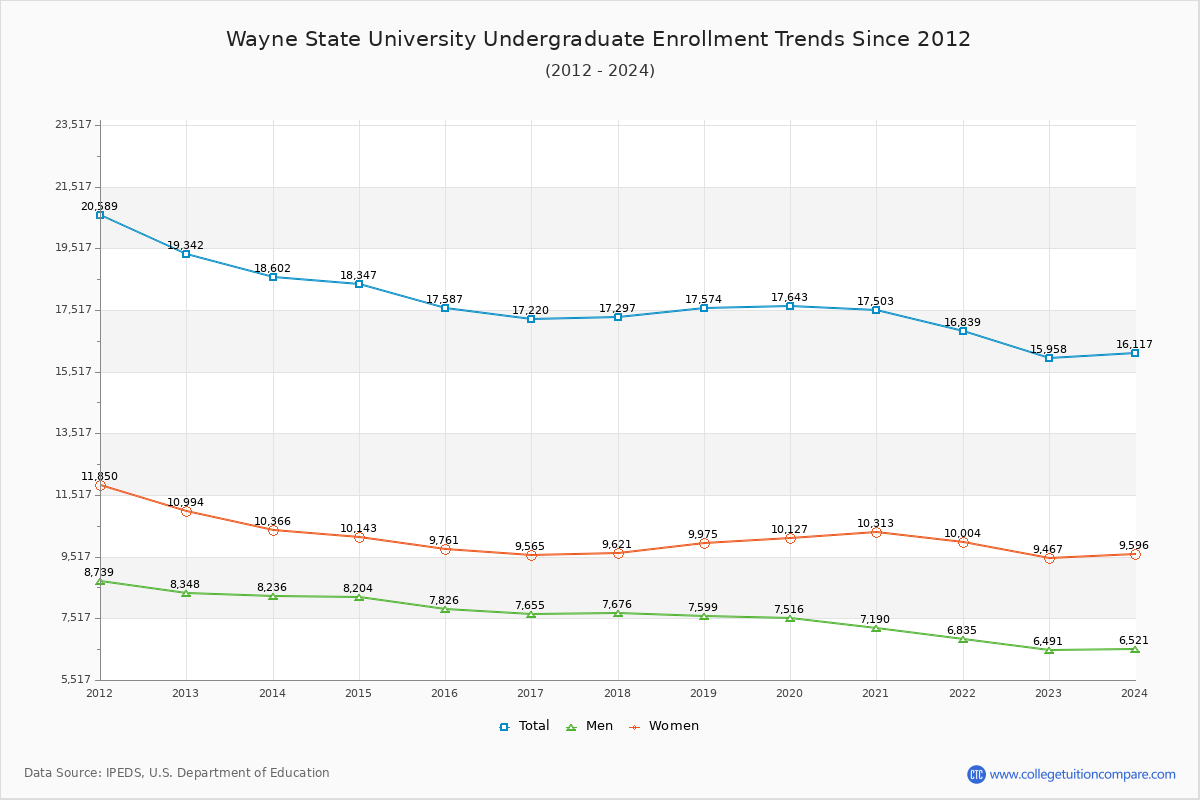
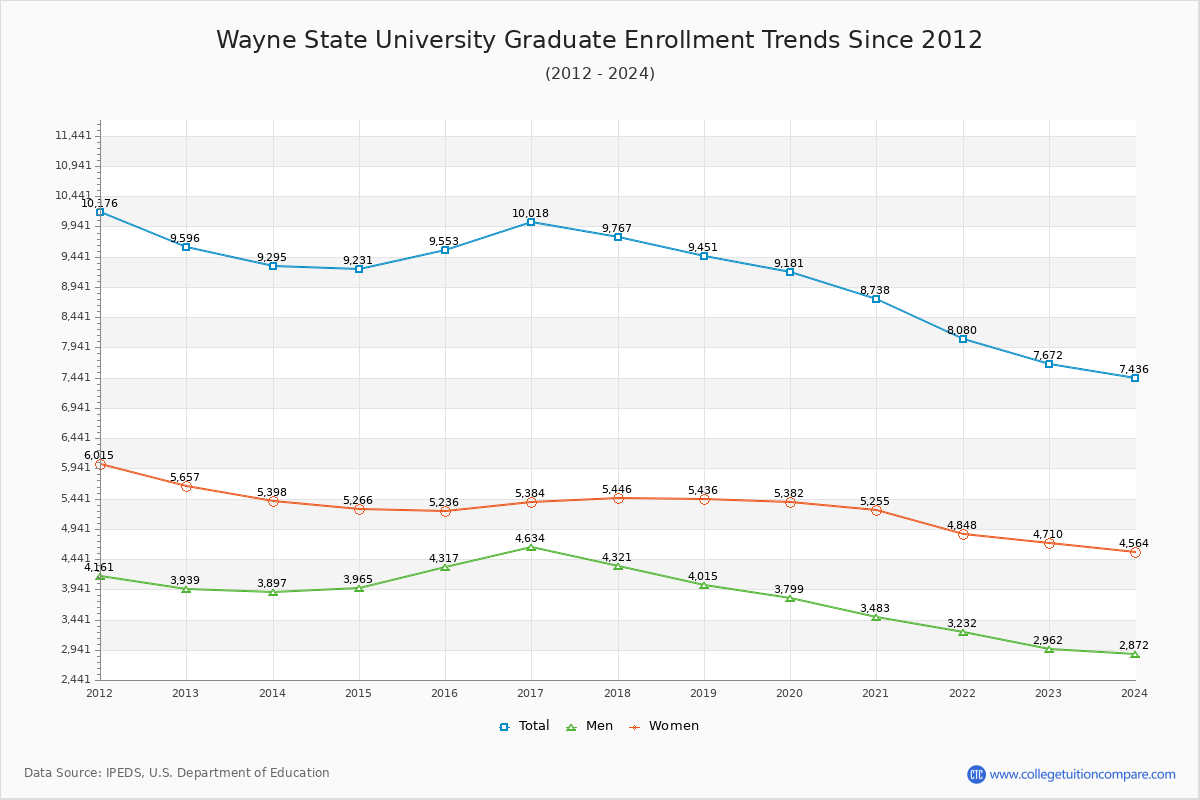
67.53% of total students is undergraduate students and 32.47% students is graduate students. The number of undergraduate students has decreased by 3,384 and the graduate enrollment has decreased by 1,924 over past 10 years.
The female to male ratio is 1.50 to 1 and it means that there are more female students enrolled in WSU than male students.
The following table and chart illustrate the changes in student population by gender at Wayne State University since 2012.
| Year | Total | Undergraduate | Graduate | ||||
|---|---|---|---|---|---|---|---|
| Total | Men | Women | Total | Men | Women | ||
| 2012-13 | 28,938 | 19,342 | 8,348 | 10,994 | 9,596 | 3,939 | 5,657 |
| 2013-14 | 27,897 -1,041 | 18,602 -740 | 8,236 -112 | 10,366 -628 | 9,295 -301 | 3,897 -42 | 5,398 -259 |
| 2014-15 | 27,578 -319 | 18,347 -255 | 8,204 -32 | 10,143 -223 | 9,231 -64 | 3,965 68 | 5,266 -132 |
| 2015-16 | 27,140 -438 | 17,587 -760 | 7,826 -378 | 9,761 -382 | 9,553 322 | 4,317 352 | 5,236 -30 |
| 2016-17 | 27,238 98 | 17,220 -367 | 7,655 -171 | 9,565 -196 | 10,018 465 | 4,634 317 | 5,384 148 |
| 2017-18 | 27,064 -174 | 17,297 77 | 7,676 21 | 9,621 56 | 9,767 -251 | 4,321 -313 | 5,446 62 |
| 2018-19 | 27,025 -39 | 17,574 277 | 7,599 -77 | 9,975 354 | 9,451 -316 | 4,015 -306 | 5,436 -10 |
| 2019-20 | 26,824 -201 | 17,643 69 | 7,516 -83 | 10,127 152 | 9,181 -270 | 3,799 -216 | 5,382 -54 |
| 2020-21 | 26,241 -583 | 17,503 -140 | 7,190 -326 | 10,313 186 | 8,738 -443 | 3,483 -316 | 5,255 -127 |
| 2021-22 | 24,919 -1,322 | 16,839 -664 | 6,835 -355 | 10,004 -309 | 8,080 -658 | 3,232 -251 | 4,848 -407 |
| 2022-23 | 23,630 -1,289 | 15,958 -881 | 6,491 -344 | 9,467 -537 | 7,672 -408 | 2,962 -270 | 4,710 -138 |
| Average | 26,772 | 17,628 | 7,598 | 10,031 | 9,144 | 3,869 | 5,274 |