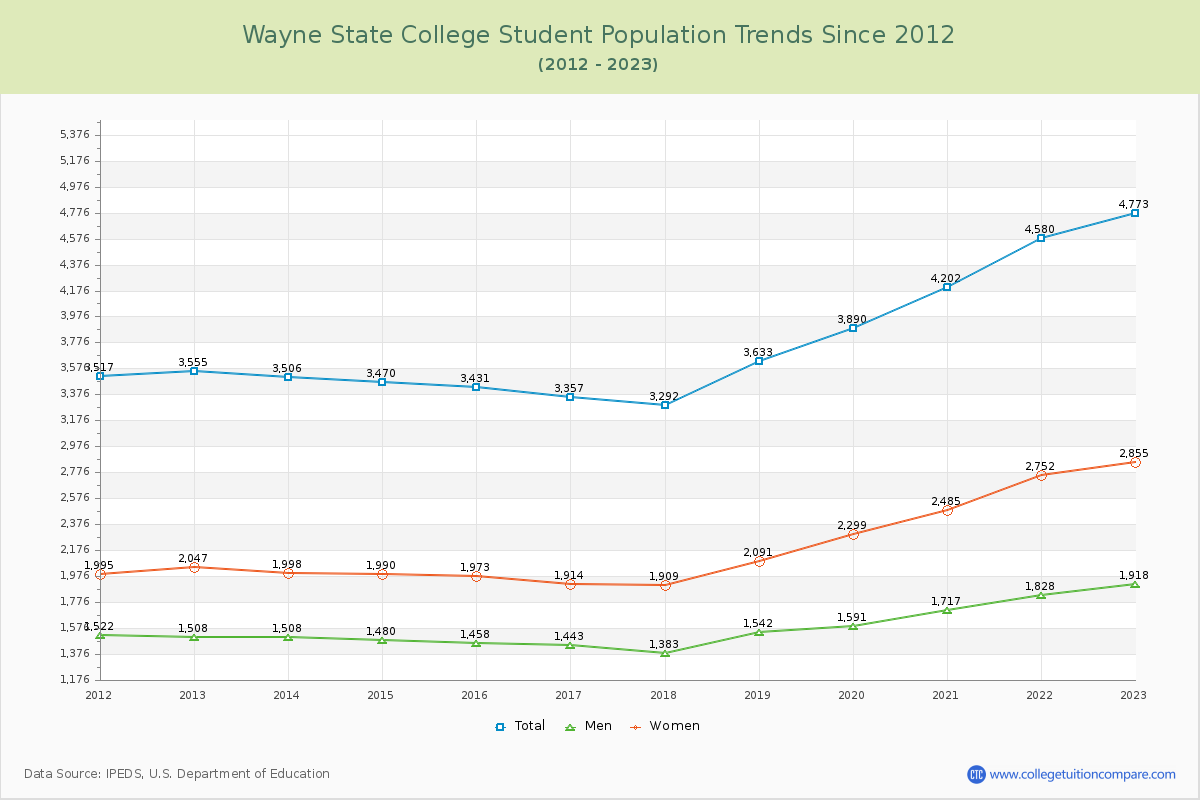
Student Population Changes
The average student population over the last 12 years is 3,790 where 4,773 students are attending the school for the academic year 2022-2023.
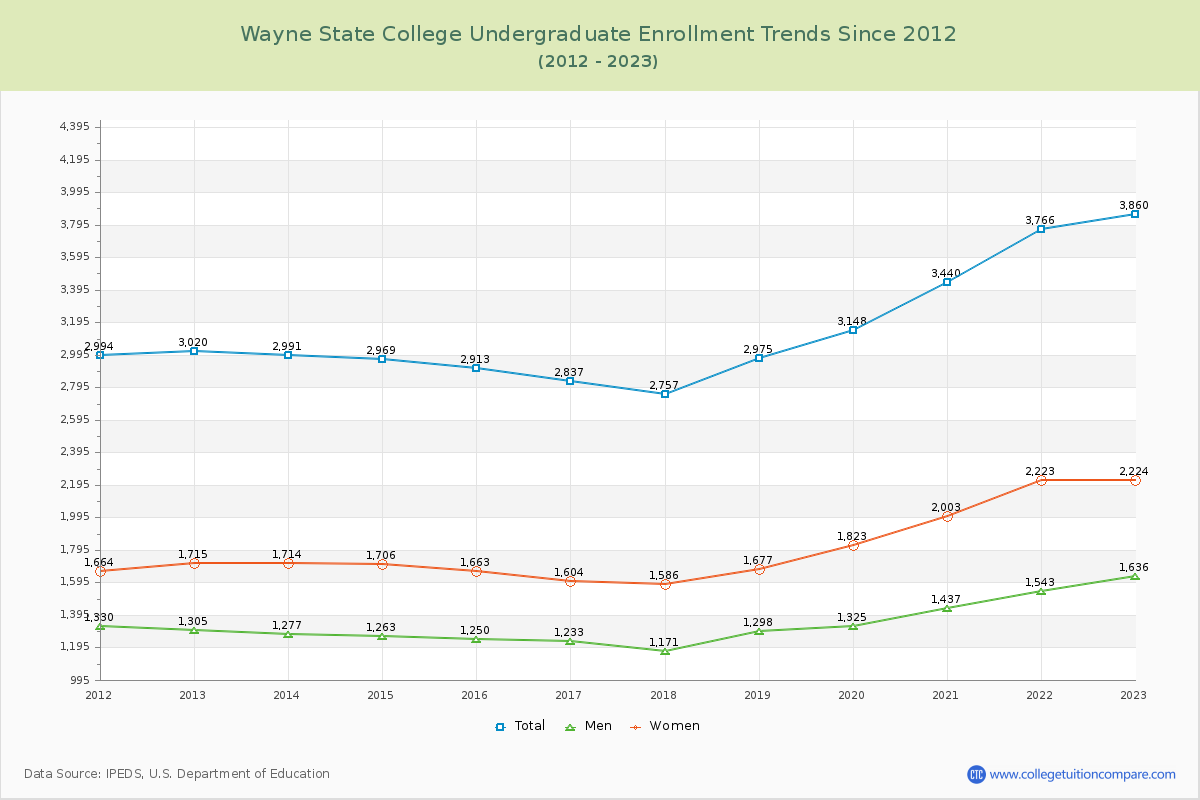
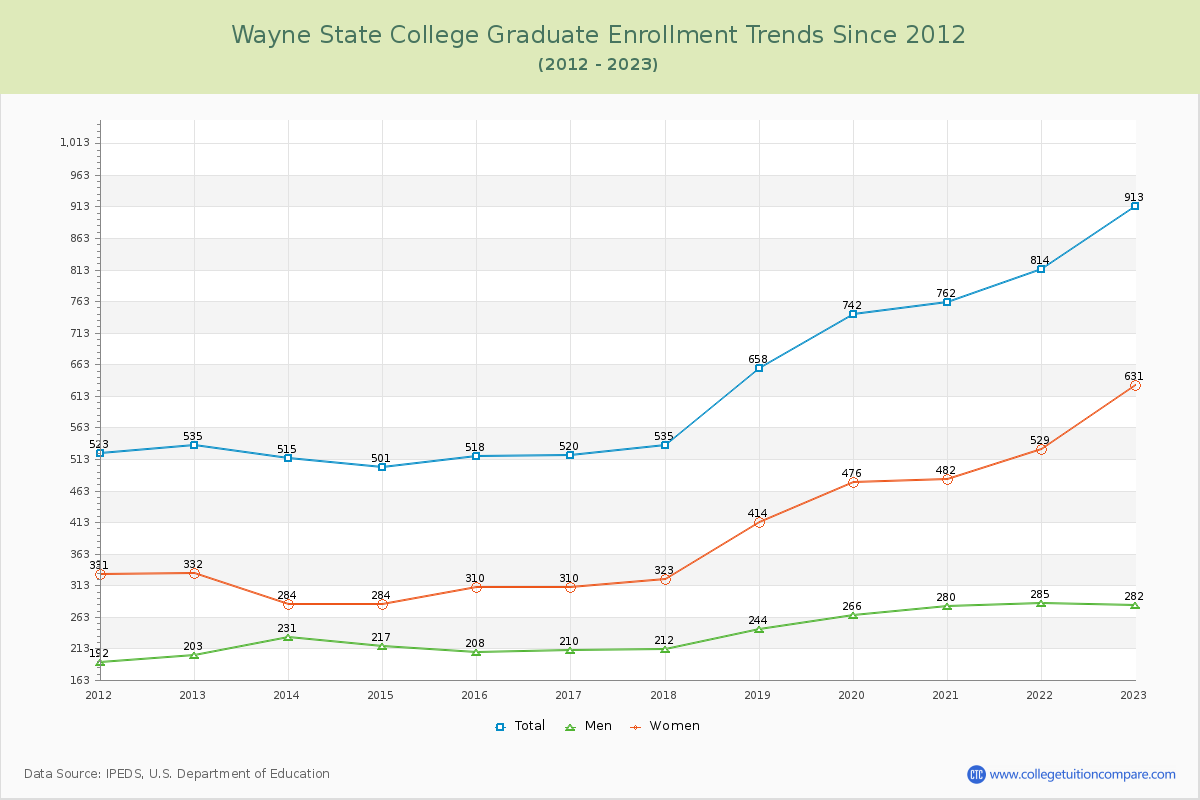
80.87% of total students is undergraduate students and 19.13% students is graduate students. The number of undergraduate students has increased by 840 and the graduate enrollment has increased by 378 over past 10 years.
The female to male ratio is 1.49 to 1 and it means that there are more female students enrolled in WSC than male students.
The following table and chart illustrate the changes in student population by gender at Wayne State College since 2012.
| Year | Total | Undergraduate | Graduate | ||||
|---|---|---|---|---|---|---|---|
| Total | Men | Women | Total | Men | Women | ||
| 2012-13 | 3,555 | 3,020 | 1,305 | 1,715 | 535 | 203 | 332 |
| 2013-14 | 3,506 -49 | 2,991 -29 | 1,277 -28 | 1,714 -1 | 515 -20 | 231 28 | 284 -48 |
| 2014-15 | 3,470 -36 | 2,969 -22 | 1,263 -14 | 1,706 -8 | 501 -14 | 217 -14 | 284 0 |
| 2015-16 | 3,431 -39 | 2,913 -56 | 1,250 -13 | 1,663 -43 | 518 17 | 208 -9 | 310 26 |
| 2016-17 | 3,357 -74 | 2,837 -76 | 1,233 -17 | 1,604 -59 | 520 2 | 210 2 | 310 0 |
| 2017-18 | 3,292 -65 | 2,757 -80 | 1,171 -62 | 1,586 -18 | 535 15 | 212 2 | 323 13 |
| 2018-19 | 3,633 341 | 2,975 218 | 1,298 127 | 1,677 91 | 658 123 | 244 32 | 414 91 |
| 2019-20 | 3,890 257 | 3,148 173 | 1,325 27 | 1,823 146 | 742 84 | 266 22 | 476 62 |
| 2020-21 | 4,202 312 | 3,440 292 | 1,437 112 | 2,003 180 | 762 20 | 280 14 | 482 6 |
| 2021-22 | 4,580 378 | 3,766 326 | 1,543 106 | 2,223 220 | 814 52 | 285 5 | 529 47 |
| 2022-23 | 4,773 193 | 3,860 94 | 1,636 93 | 2,224 1 | 913 99 | 282 -3 | 631 102 |
| Average | 3,790 | 3,152 | 1,340 | 1,813 | 638 | 240 | 398 |