Enrollment Trends at WSCC

548

Total Enrollment

152

Men

396

Women

The student population at Washington State College of Ohio is 2,025 (all undergraduate). The number of students has increased by 548 over the past decade.

The female to male ratio is 1.89 to 1 which means that female students enrolled more than male students.

358 students enrolled in online degree program exclusively and the number of online students has increased by 179.69% since 2015.

Student Population Changes

The average student population over the last 11 years is 1,758 where 2,025 students are attending the school for the academic year 2024-2025.

The female to male ratio is 1.89 to 1 and it means that there are more female students enrolled in WSCC than male students.

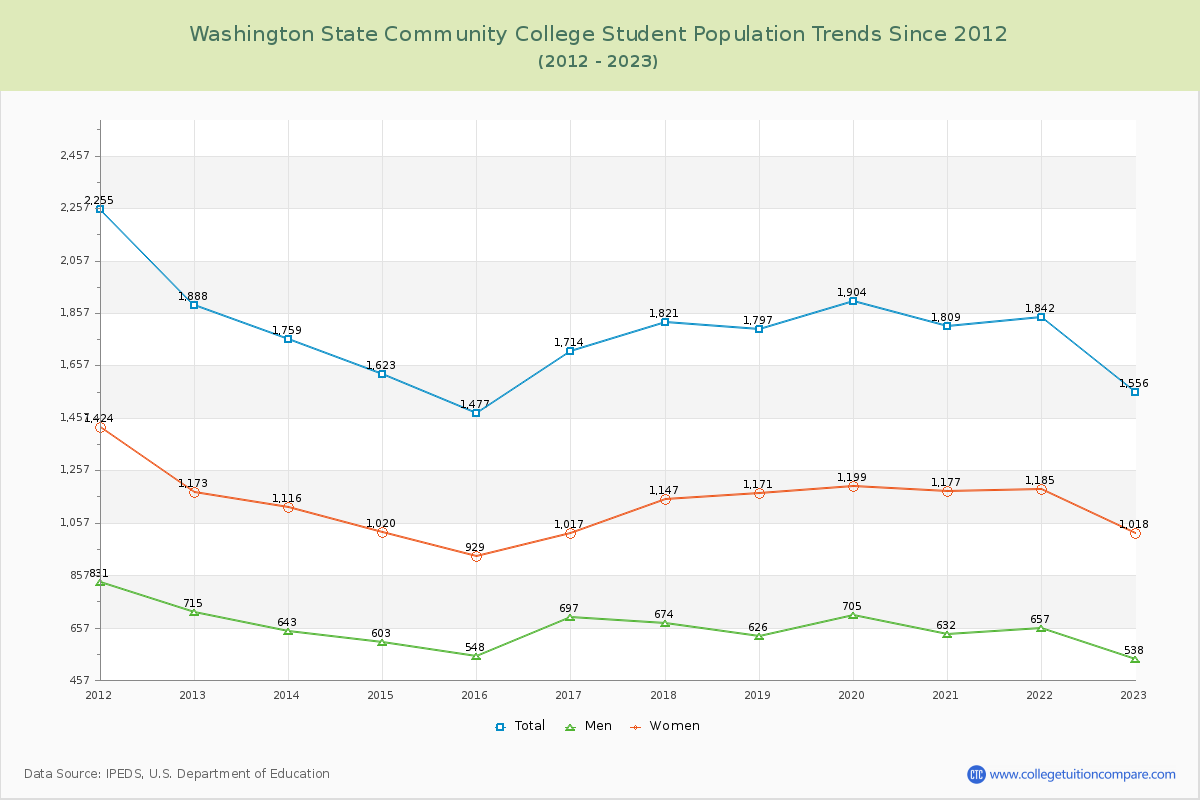
The following table and chart illustrate the changes in student population by gender at Washington State College of Ohio since 2015.

YearTotalMenWomen
2015-161,477548929
2016-171,714
237
697
149
1,017
88
2017-181,821
107
674
-23
1,147
130
2018-191,797
-24
626
-48
1,171
24
2019-201,904
107
705
79
1,199
28
2020-211,809
-95
632
-73
1,177
-22
2021-221,842
33
657
25
1,185
8
2022-231,556
-286
538
-119
1,018
-167
2023-241,637
81
578
40
1,059
41
2024-252,025
388
700
122
1,325
266
Average1,7586361,123
Washington State College of Ohio Enrollment Trends Chart

Enrollment by Race/Ethnicity Changes

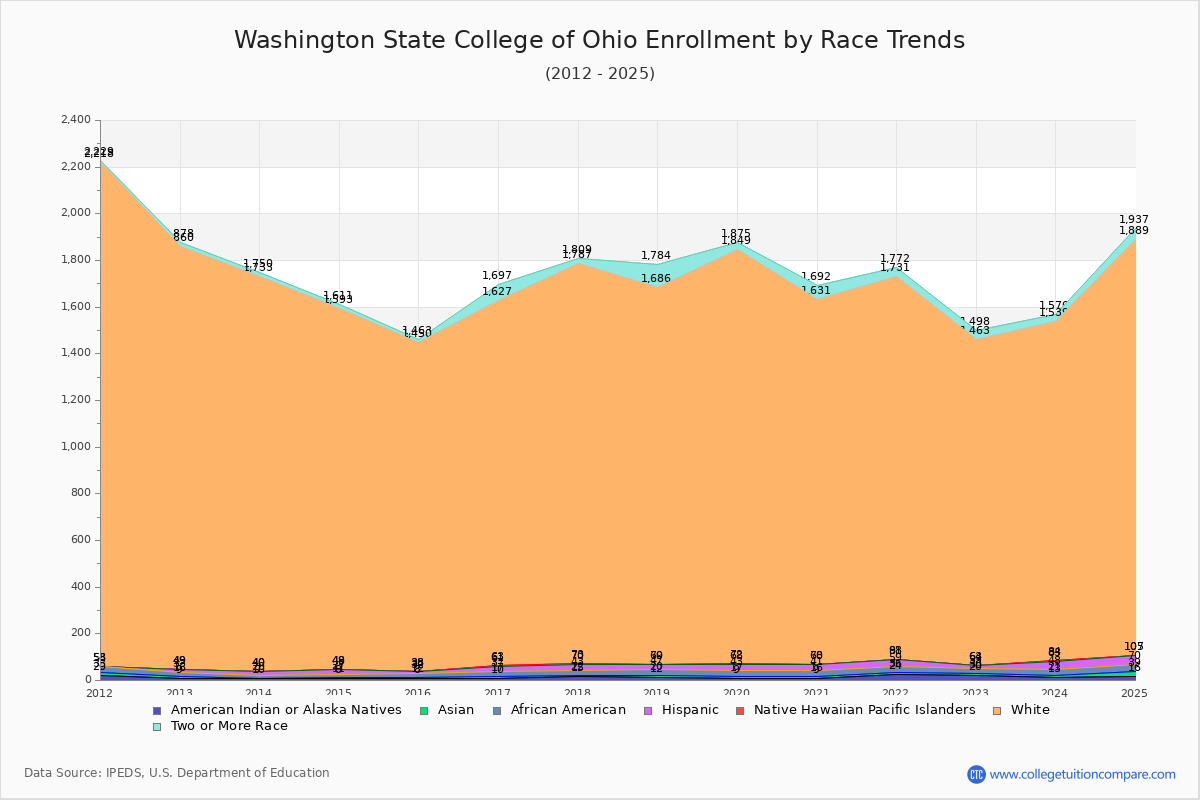
The percentage of white students is 88.00%. The percentage was 95.60% 10 years ago and WSCC still has a high percentage of white students. 1.14% of enrolled students is Asian and 1.53% is black students. Hispanic students comprise 1.73% of the student body.

Over the past 10 years, the racial composition has shifted. The percentage of white students decreased from 95.60% to 88.00%. Asian enrollment grew from 0.27% to 1.14%. Black student enrollment increased from 1.35% to 1.53%. Hispanic student representation expanded from 0.41% to 1.73%.

The overall racial diversity, measured by the Census Bureau Diversity Index, is 0.2243 which indicates that not very diverse. This increased from 0.0858 a decade ago, suggesting that racial diversity has improved.

The following table and chart illustrate the student population trends by race/ethnicity at Washington State College of Ohio over the past 11 years (2015-2025).

YearAmerican Indian or Native AmericanAsianBlackHispanicNative Hawaiian or Other Pacific IslanderWhiteTwo or More Races
2015-168420601,41213
2016-17107202421,56470
2017-18157212731,71422
2018-19128272211,61698
2019-2098262541,77726
2020-2197252721,56161
2021-222412232931,64041
2022-232010231011,39935
2023-24138273511,45531
2024-251623313521,78248
Average149242421,59245
Washington State College of Ohio Enrollment by Race Trends Chart

Distance Learning (Online Courses) Enrollment Changes

358 students are enrolled in online degree programs exclusively for the academic year 2024-2025, which is 18% of total students. The number of online students has increased 179.69% since 2015. The following table and chart illustrate the changes in the online student population by enrolled type at Washington State College of Ohio from 2015 to 2025.

YearTotal EnrollmentOnline CompletelyEnrolled in Some Online CoursesNot Enrolled in Online Courses
2015-161,477128518831
2016-171,7141494911,074
2017-181,8211994911,131
2018-191,797208672917
2019-201,9041595921,153
2020-211,809224684901
2021-221,842170899773
2022-231,556220828508
2023-241,6372901,002345
2024-252,0253581,223444
Average1,758211740808

Ratings & Review

Share your experiences and thoughts about Washington State College of Ohio. It will be a great help to applicants and prospective students!