Student Population Changes
The average student population over the last 12 years is 1,308 where 1,151 students are attending the school for the academic year 2022-2023.
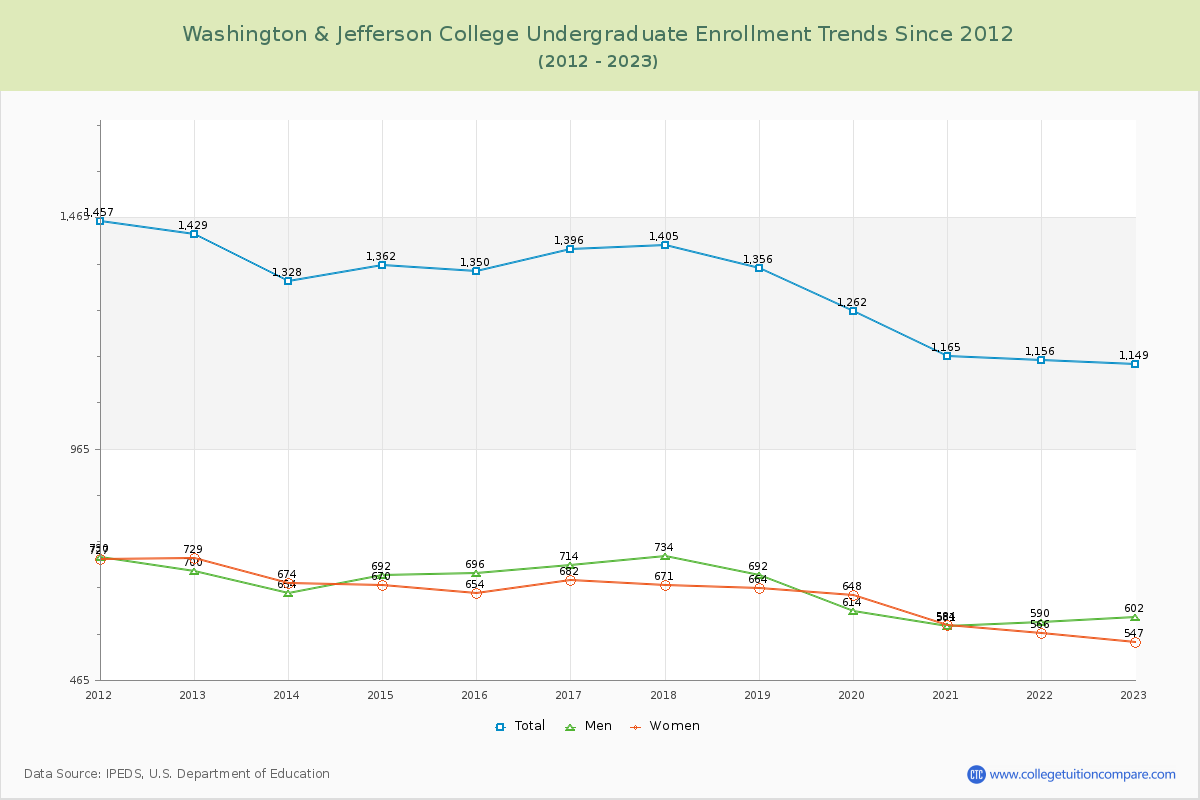
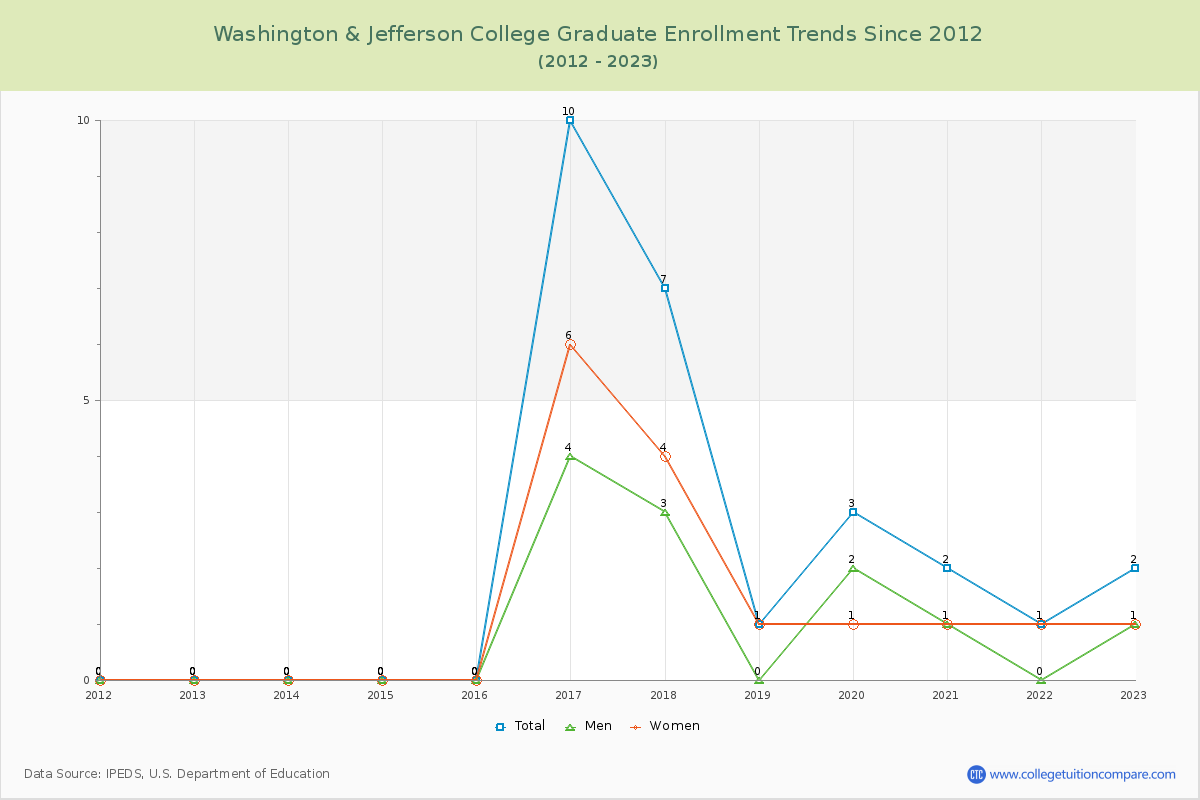
99.83% of total students is undergraduate students and 0.17% students is graduate students. The number of undergraduate students has decreased by 280 and the graduate enrollment has increased by 2 over past 10 years.
The female to male ratio is 0.91 to 1 and it means that there are similar numbers of female and male students enrolled in W&J.
The following table and chart illustrate the changes in student population by gender at Washington & Jefferson College since 2012.
| Year | Total | Undergraduate | Graduate | ||||
|---|---|---|---|---|---|---|---|
| Total | Men | Women | Total | Men | Women | ||
| 2012-13 | 1,429 | 1,429 | 700 | 729 | 0 | 0 | 0 |
| 2013-14 | 1,328 -101 | 1,328 -101 | 654 -46 | 674 -55 | 0 0 | 0 0 | 0 0 |
| 2014-15 | 1,362 34 | 1,362 34 | 692 38 | 670 -4 | 0 0 | 0 0 | 0 0 |
| 2015-16 | 1,350 -12 | 1,350 -12 | 696 4 | 654 -16 | 0 0 | 0 0 | 0 0 |
| 2016-17 | 1,406 56 | 1,396 46 | 714 18 | 682 28 | 10 10 | 4 4 | 6 6 |
| 2017-18 | 1,412 6 | 1,405 9 | 734 20 | 671 -11 | 7 -3 | 3 -1 | 4 -2 |
| 2018-19 | 1,357 -55 | 1,356 -49 | 692 -42 | 664 -7 | 1 -6 | 0 -3 | 1 -3 |
| 2019-20 | 1,265 -92 | 1,262 -94 | 614 -78 | 648 -16 | 3 2 | 2 2 | 1 0 |
| 2020-21 | 1,167 -98 | 1,165 -97 | 581 -33 | 584 -64 | 2 -1 | 1 -1 | 1 0 |
| 2021-22 | 1,157 -10 | 1,156 -9 | 590 9 | 566 -18 | 1 -1 | 0 -1 | 1 0 |
| 2022-23 | 1,151 -6 | 1,149 -7 | 602 12 | 547 -19 | 2 1 | 1 1 | 1 0 |
| Average | 1,308 | 1,305 | 661 | 644 | 2 | 1 | 1 |