Enrollment Trends at Washington Adventist

-432

Total Enrollment

-175

Men

-257

Women

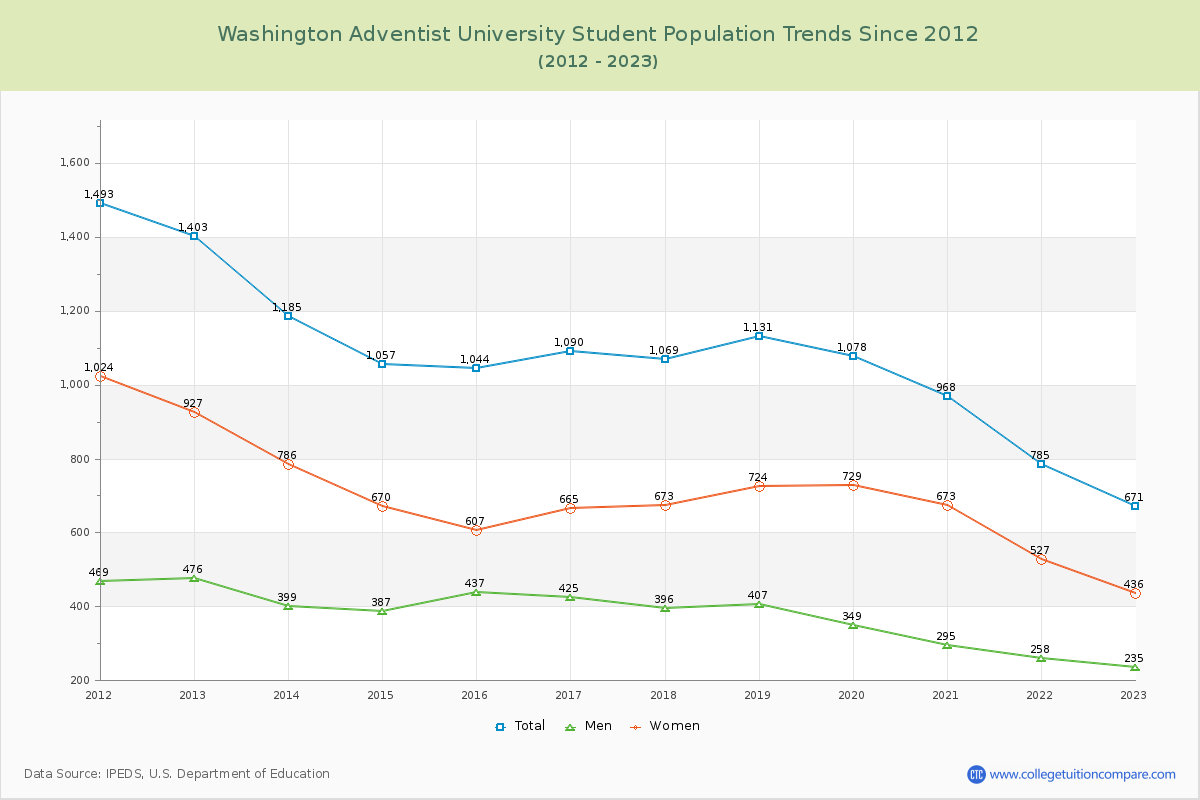
The student population at Washington Adventist University is 612 (513 undergraduate and 99 graduate students) . The number of students has decreased by 432 over the past decade.

The percentage of undergraduate students at Washington Adventist is 83.82% which is decreased by 364 over last 10 years. The graduate student population decreased by 68 and it has been decreasing.

The female to male ratio is 1.34 to 1 which means that female students enrolled more than male students.

85 students enrolled in online degree program exclusively and the number of online students has increased by 325.00% since 2015.

Student Population Changes

The average student population over the last 11 years is 914 where 612 students are attending the school for the academic year 2024-2025.

83.82% of total students is undergraduate students and 16.18% students is graduate students. The number of undergraduate students has decreased by 364 and the graduate enrollment has decreased by 68 over past 10 years.

The female to male ratio is 1.34 to 1 and it means that there are more female students enrolled in Washington Adventist than male students.

The following table and chart illustrate the changes in student population by gender at Washington Adventist University since 2015.

YearTotalUndergraduateGraduate
TotalMenWomenTotalMenWomen
2015-161,04487738848916749118
2016-171,090
46
911
34
371
-17
540
51
179
12
54
5
125
7
2017-181,069
-21
873
-38
332
-39
541
1
196
17
64
10
132
7
2018-191,131
62
960
87
352
20
608
67
171
-25
55
-9
116
-16
2019-201,078
-53
945
-15
315
-37
630
22
133
-38
34
-21
99
-17
2020-21968
-110
845
-100
270
-45
575
-55
123
-10
25
-9
98
-1
2021-22785
-183
690
-155
234
-36
456
-119
95
-28
24
-1
71
-27
2022-23671
-114
582
-108
210
-24
372
-84
89
-6
25
1
64
-7
2023-24695
24
605
23
249
39
356
-16
90
1
24
-1
66
2
2024-25612
-83
513
-92
225
-24
288
-68
99
9
37
13
62
-4
Average9147802954861343995
Washington Adventist University Enrollment Trends Chart

Undergraduate Enrollment Changes

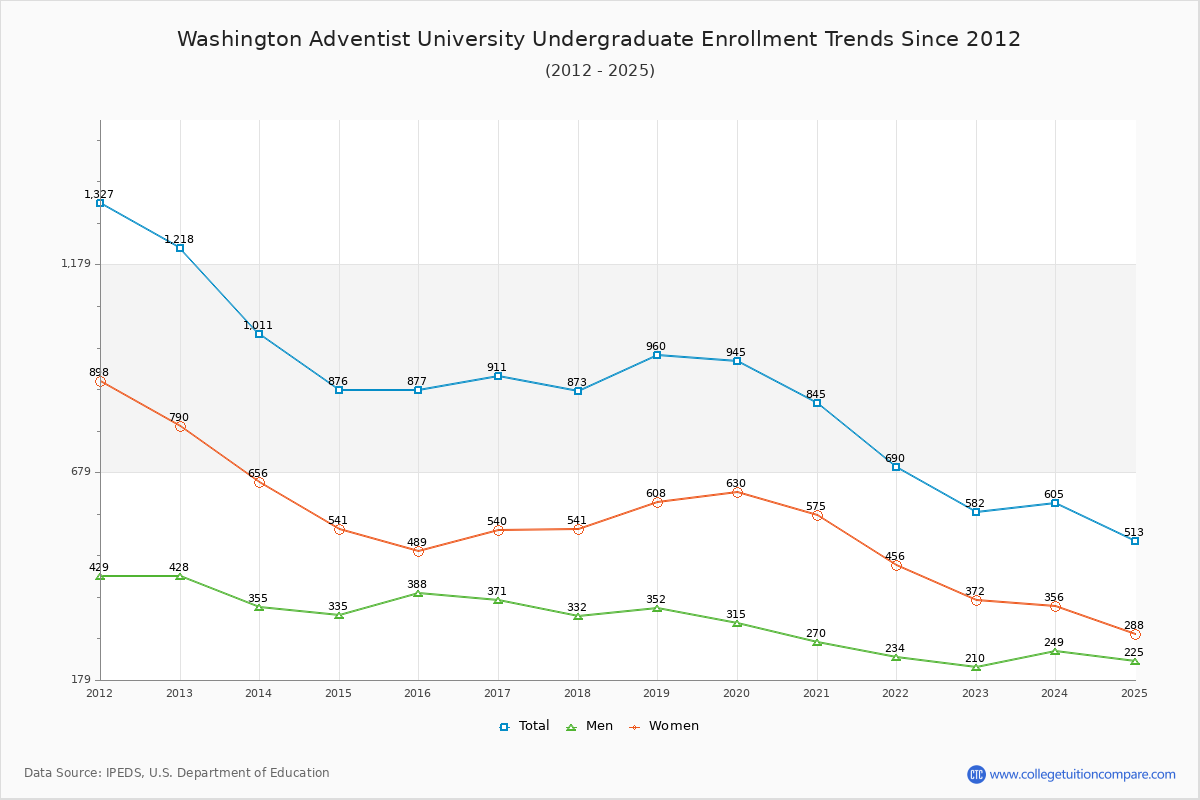
The average number of Undergraduate students over the last 11 years is 780 where 513 students are attending the Undergraduate school for the academic year 2024-2025. The following table and chart illustrate the changes in Undergraduate enrollment by attending status and gender at Washington Adventist University since 2015.

YearTotalFull-timePart-time
TotalMenWomenTotalMenWomen
2015-1687765930935021879139
2016-1791169829540321376137
2017-1887365525440121878140
2018-1996074926548421187124
2019-2094572324148222274148
2020-2184562419542922175146
2021-2269048115632520978131
2022-2358242415327115857101
2023-246054441872571616299
2024-255134081872211053867
Average78078022436278070123
Washington Adventist University Undergraduate Enrollment Trends Chart

Graduate Enrollment Changes

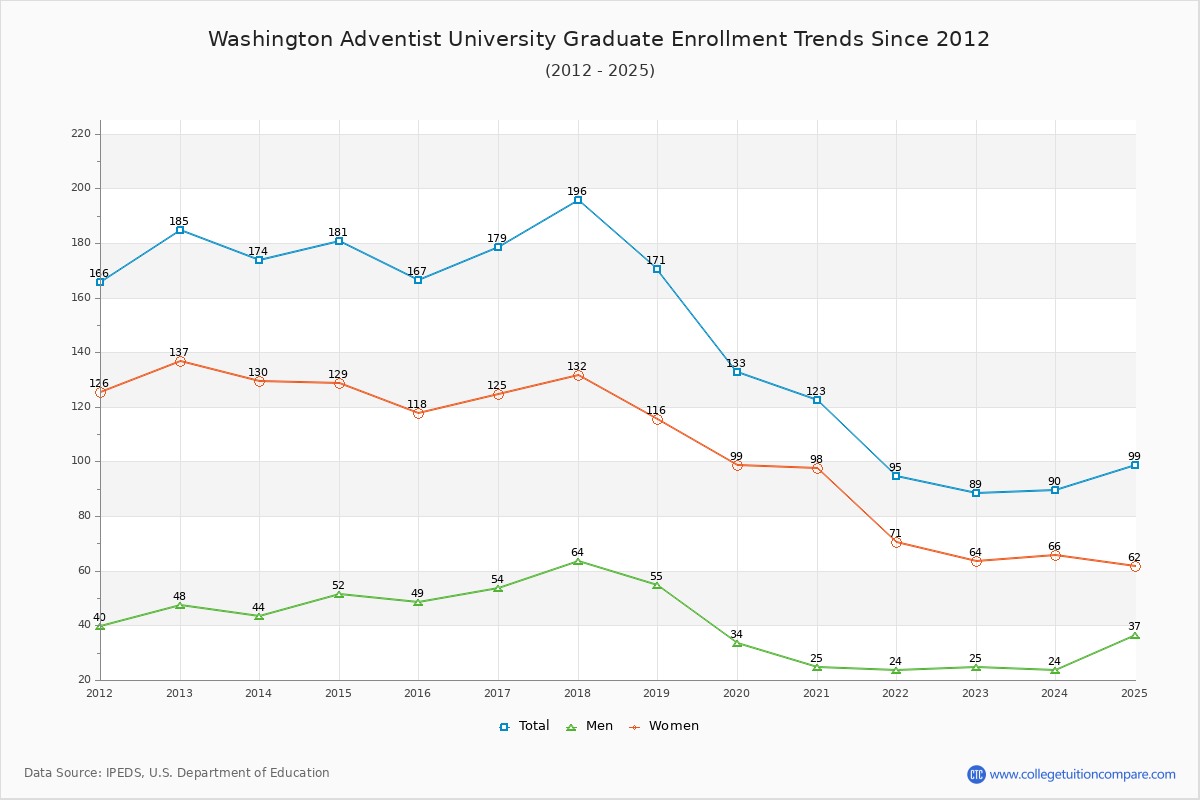
The average number of Graduate students over the last 11 years is 134 where 99 students are attending the Graduate school for the academic year 2024-2025. The following table and chart illustrate the changes in Graduate enrollment by attending status and gender at Washington Adventist University since 2015.

YearTotalFull-timePart-time
TotalMenWomenTotalMenWomen
2015-16167701852973166
2016-17179802258993267
2017-181965721361394396
2018-191716322411083375
2019-20133481137852362
2020-21123173141062284
2021-229521516741955
2022-238922517672047
2023-249029524611942
2024-2599461729532033
Average13413413321342663
Washington Adventist University Graduate Enrollment Trends Chart

Enrollment by Race/Ethnicity Changes

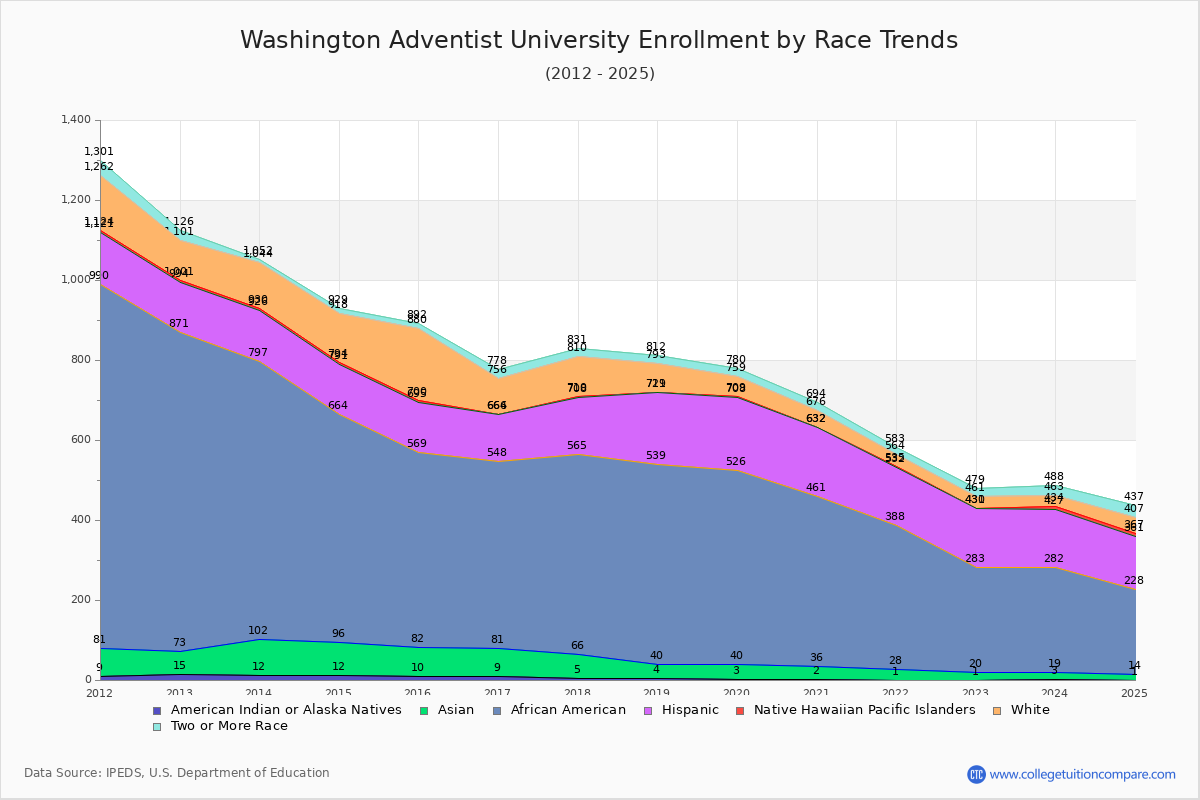
The percentage of white students is 6.54% and the percentage of black students is 34.97% at Washington Adventist University. 2.12% of enrolled students is Asian. Hispanic students comprise 21.73% of the student body.

Over the past 10 years, the racial composition has shifted. The percentage of white students decreased from 17.24% to 6.54%. Asian enrollment declined from 6.90% to 2.12%. Black student enrollment decreased from 46.65% to 34.97%. Hispanic student representation expanded from 12.07% to 21.73%.

The overall racial diversity, measured by the Census Bureau Diversity Index, is 0.8233 which indicates that highly diverse. This increased from 0.7331 a decade ago, suggesting that racial diversity has improved.

The following table and chart illustrate the student population trends by race/ethnicity at Washington Adventist University over the past 11 years (2015-2025).

YearAmerican Indian or Native AmericanAsianBlackHispanicNative Hawaiian or Other Pacific IslanderWhiteTwo or More Races
2015-161072487126518012
2016-1797246711629022
2017-18561499143210021
2018-1943649918027219
2019-2033748618215021
2020-2123442517104418
2021-2212736014432919
2022-2311926314713018
2023-2431626314572925
2024-2511321413364030
Average43939614936621
Washington Adventist University Enrollment by Race Trends Chart

Distance Learning (Online Courses) Enrollment Changes

85 students are enrolled in online degree programs exclusively for the academic year 2024-2025, which is 14% of total students. The number of online students has increased 325.00% since 2015. The following table and chart illustrate the changes in the online student population by enrolled type at Washington Adventist University from 2015 to 2025.

YearTotal EnrollmentOnline CompletelyEnrolled in Some Online CoursesNot Enrolled in Online Courses
2015-161,0442084940
2016-171,09031109950
2017-181,06927119923
2018-191,13123139969
2019-201,07820166892
2020-21968481344143
2021-2278547371367
2022-2367137123511
2023-2469549126520
2024-2561285115412
Average91482170663

Ratings & Review

Share your experiences and thoughts about Washington Adventist University. It will be a great help to applicants and prospective students!