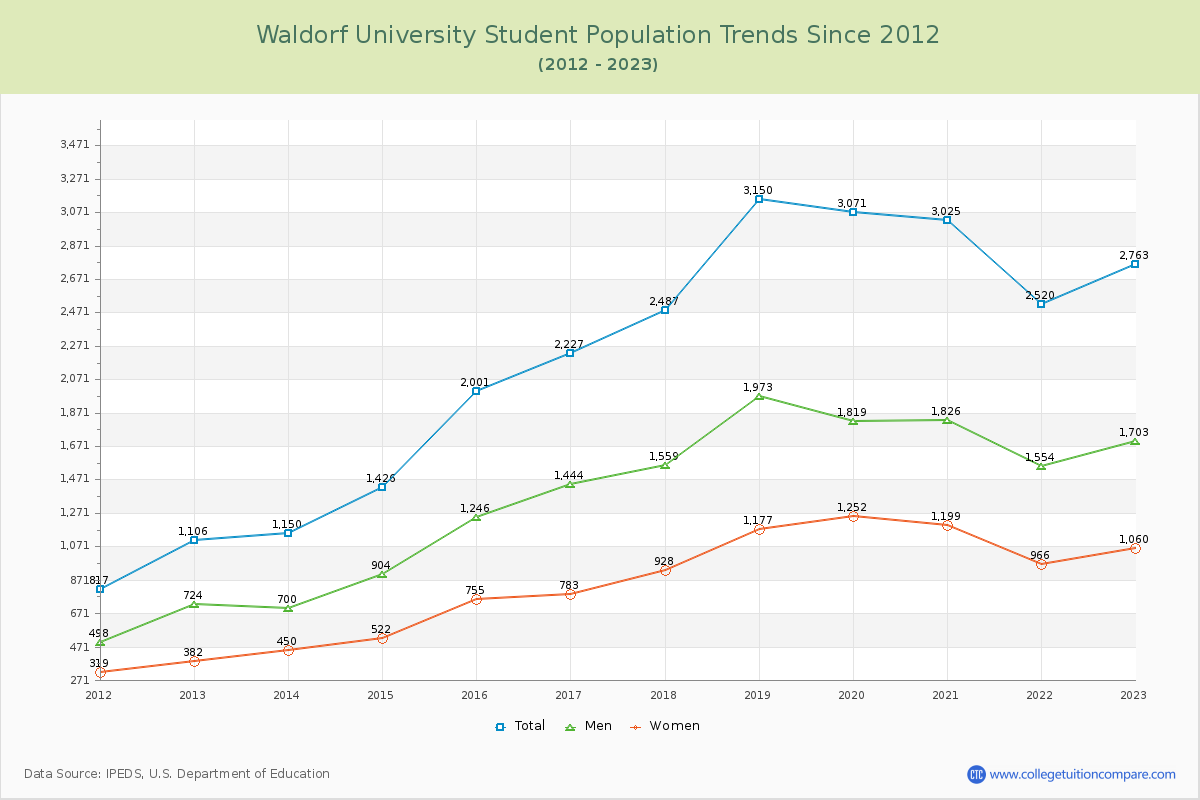
Student Population Changes
The average student population over the last 12 years is 2,266 where 2,763 students are attending the school for the academic year 2022-2023.
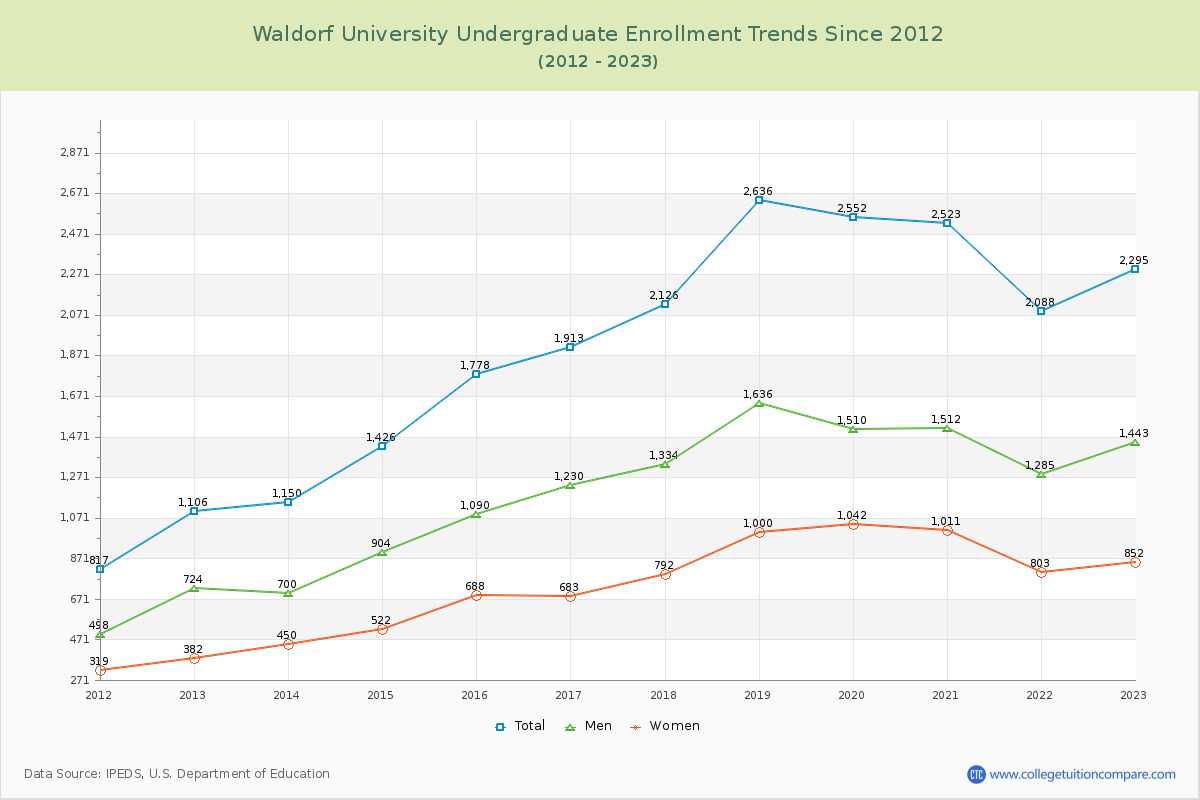
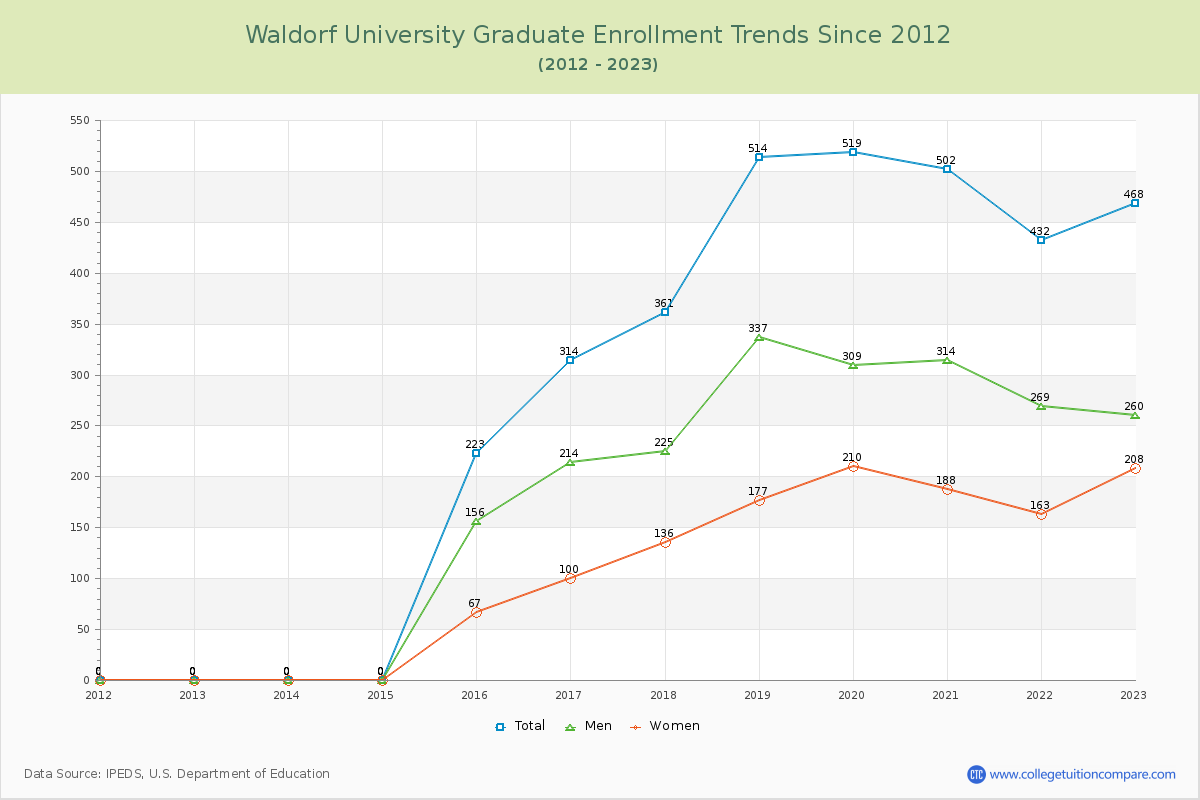
83.06% of total students is undergraduate students and 16.94% students is graduate students. The number of undergraduate students has increased by 1,189 and the graduate enrollment has increased by 468 over past 10 years.
The female to male ratio is 0.62 to 1 and it means that there are more male students enrolled in Waldorf than female students.
The following table and chart illustrate the changes in student population by gender at Waldorf University since 2012.
| Year | Total | Undergraduate | Graduate | ||||
|---|---|---|---|---|---|---|---|
| Total | Men | Women | Total | Men | Women | ||
| 2012-13 | 1,106 | 1,106 | 724 | 382 | 0 | 0 | 0 |
| 2013-14 | 1,150 44 | 1,150 44 | 700 -24 | 450 68 | 0 0 | 0 0 | 0 0 |
| 2014-15 | 1,426 276 | 1,426 276 | 904 204 | 522 72 | 0 0 | 0 0 | 0 0 |
| 2015-16 | 2,001 575 | 1,778 352 | 1,090 186 | 688 166 | 223 223 | 156 156 | 67 67 |
| 2016-17 | 2,227 226 | 1,913 135 | 1,230 140 | 683 -5 | 314 91 | 214 58 | 100 33 |
| 2017-18 | 2,487 260 | 2,126 213 | 1,334 104 | 792 109 | 361 47 | 225 11 | 136 36 |
| 2018-19 | 3,150 663 | 2,636 510 | 1,636 302 | 1,000 208 | 514 153 | 337 112 | 177 41 |
| 2019-20 | 3,071 -79 | 2,552 -84 | 1,510 -126 | 1,042 42 | 519 5 | 309 -28 | 210 33 |
| 2020-21 | 3,025 -46 | 2,523 -29 | 1,512 2 | 1,011 -31 | 502 -17 | 314 5 | 188 -22 |
| 2021-22 | 2,520 -505 | 2,088 -435 | 1,285 -227 | 803 -208 | 432 -70 | 269 -45 | 163 -25 |
| 2022-23 | 2,763 243 | 2,295 207 | 1,443 158 | 852 49 | 468 36 | 260 -9 | 208 45 |
| Average | 2,266 | 1,963 | 1,215 | 748 | 303 | 189 | 114 |