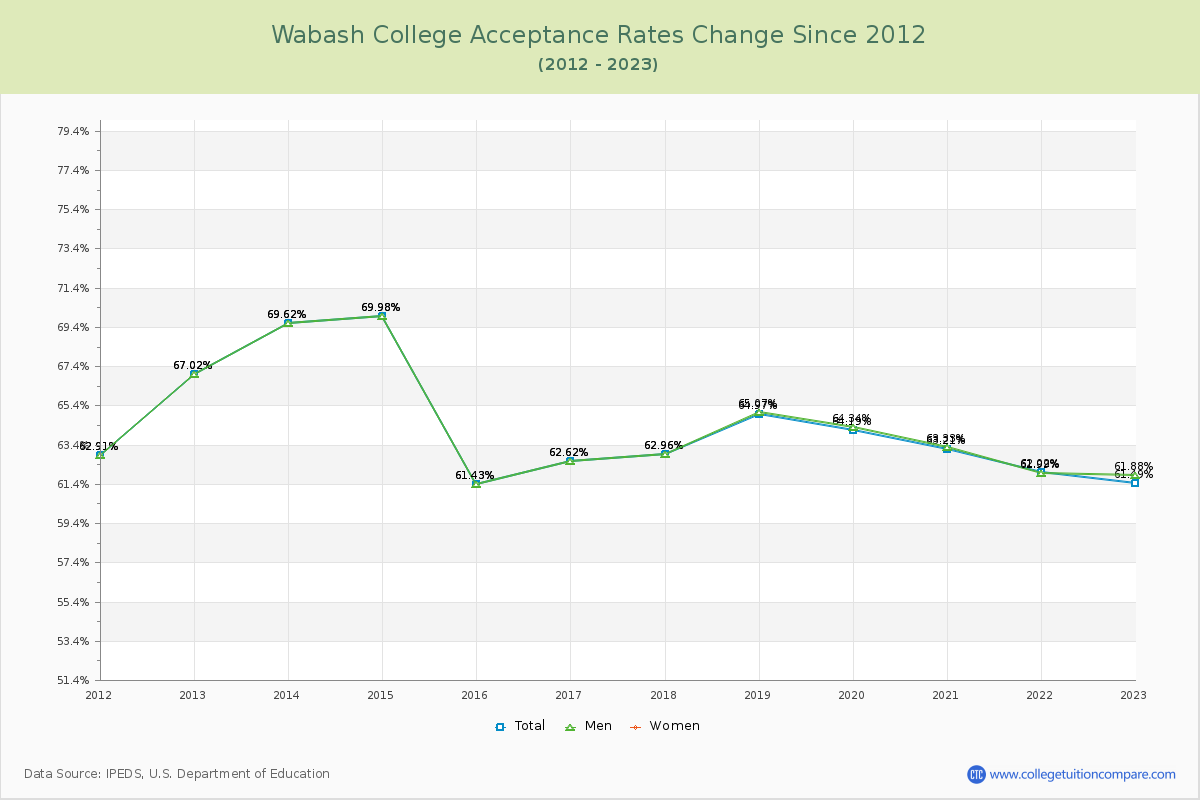
Acceptance Rate Changes
The average acceptance rate over the last 10 years is 64.50%, and this year's acceptance rate is 61.49% at Wabash College.
The next table and chart illustrate the acceptance rates changes at Wabash College over the past 11 years (2012-2023).
| Year | Total | Men | Women |
|---|---|---|---|
| 2012-13 | 67.02% | 67.02% | 0.00% |
| 2013-14 | 69.62% 2.60% |
69.62% 0.00% |
0.00% 0.00% |
| 2014-15 | 69.98% 0.36% |
69.98% 0.00% |
0.00% 0.00% |
| 2015-16 | 61.43% -8.55% |
61.43% 0.00% |
0.00% 0.00% |
| 2016-17 | 62.62% 1.19% |
62.62% 0.00% |
0.00% 0.00% |
| 2017-18 | 62.96% 0.34% |
62.96% 0.00% |
0.00% 0.00% |
| 2018-19 | 64.97% 2.01% |
65.07% 0.00% |
0.00% 0.00% |
| 2019-20 | 64.19% -0.78% |
64.34% 0.00% |
0.00% 0.00% |
| 2020-21 | 63.21% -0.99% |
63.33% 0.00% |
0.00% 0.00% |
| 2021-22 | 62.02% -1.19% |
61.99% 0.00% |
0.00% 0.00% |
| 2022-23 | 61.49% -0.52% |
61.88% 0.00% |
0.00% 0.00% |
| Average | 64.50% | 64.57% | 0.00% |