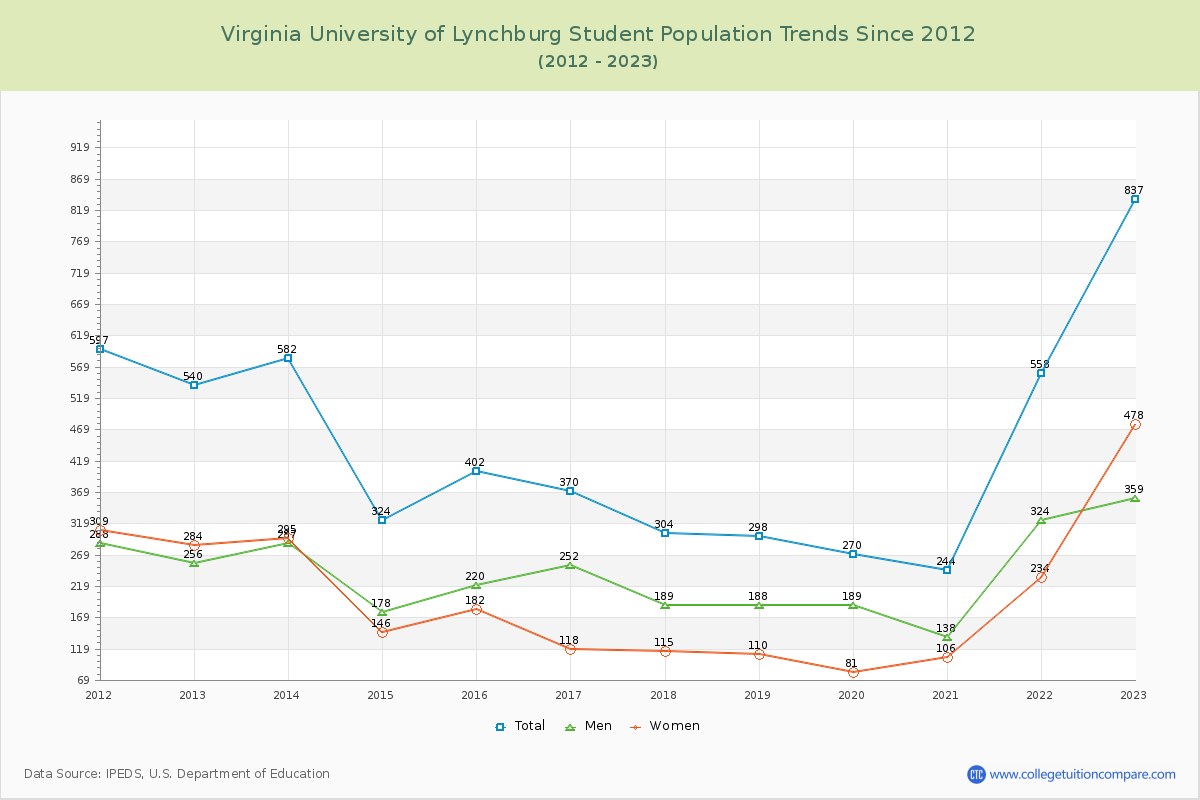
Student Population Changes
The average student population over the last 12 years is 430 where 837 students are attending the school for the academic year 2022-2023.
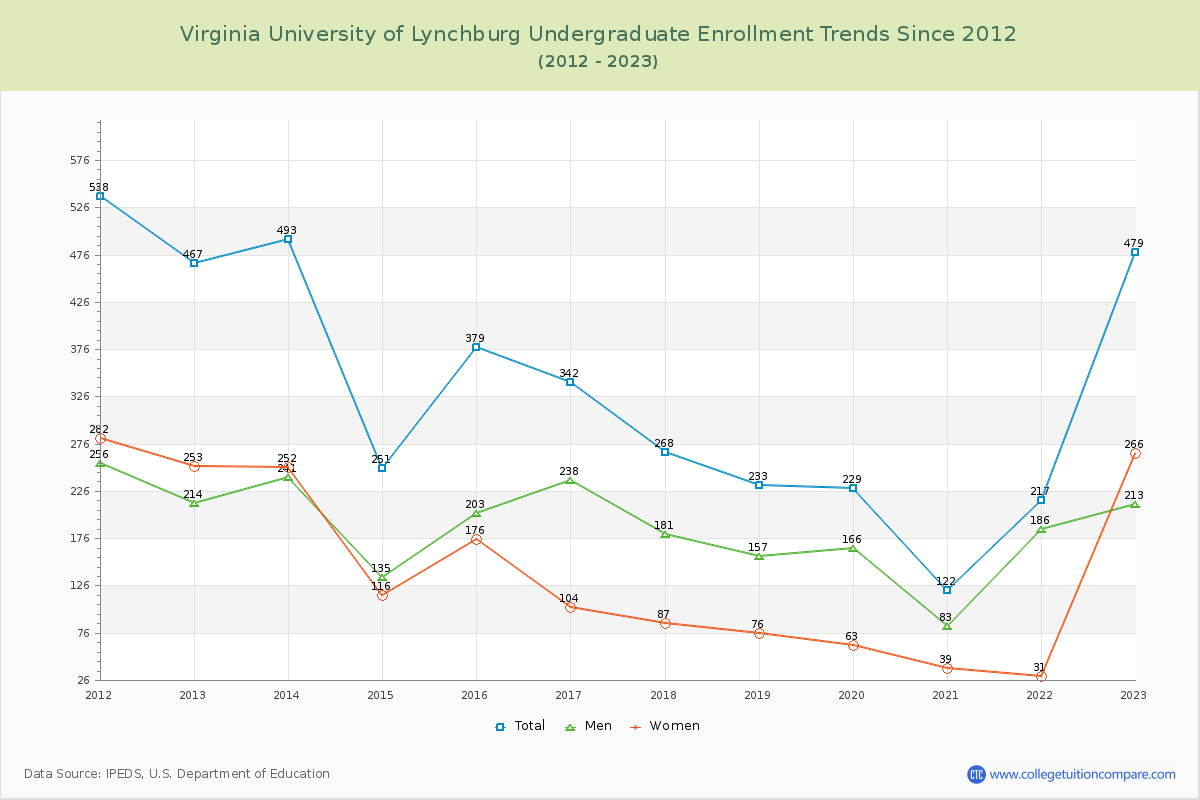
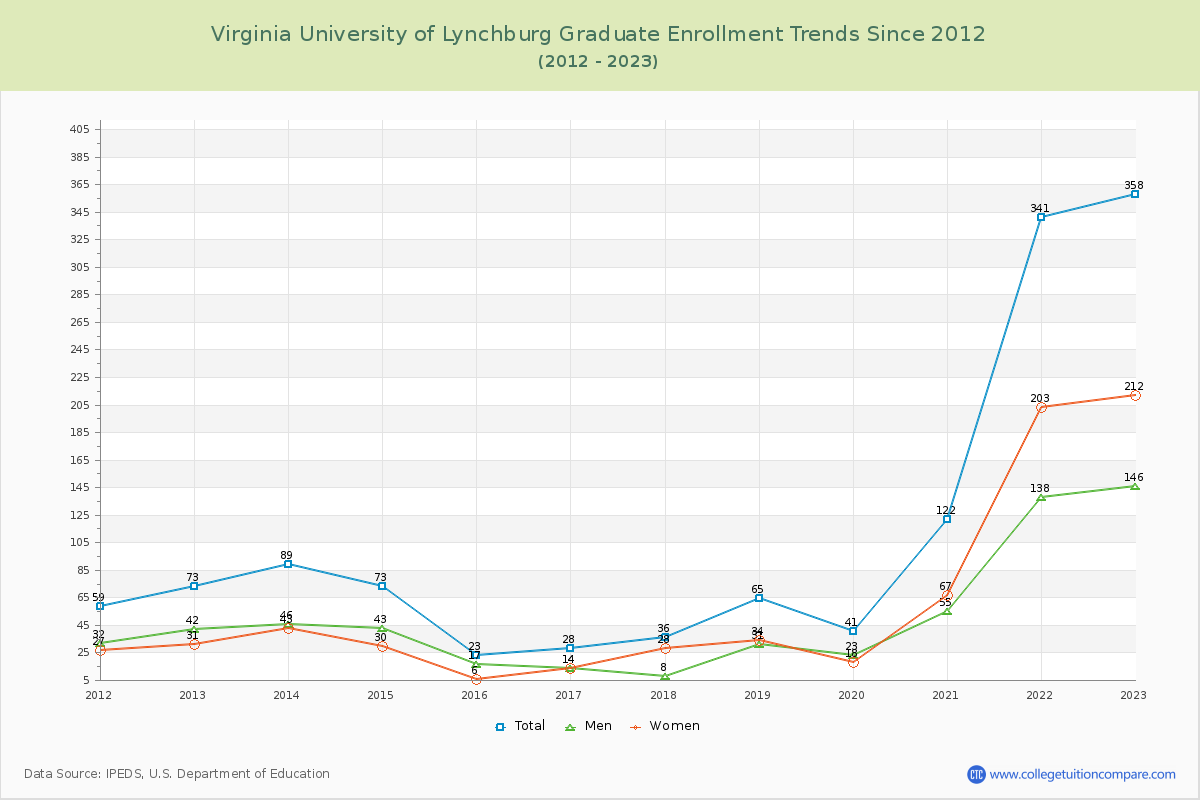
57.23% of total students is undergraduate students and 42.77% students is graduate students. The number of undergraduate students has increased by 12 and the graduate enrollment has increased by 285 over past 10 years.
The female to male ratio is 1.33 to 1 and it means that there are more female students enrolled in Virginia University of Lynchburg than male students.
The following table and chart illustrate the changes in student population by gender at Virginia University of Lynchburg since 2012.
| Year | Total | Undergraduate | Graduate | ||||
|---|---|---|---|---|---|---|---|
| Total | Men | Women | Total | Men | Women | ||
| 2012-13 | 540 | 467 | 214 | 253 | 73 | 42 | 31 |
| 2013-14 | 582 42 | 493 26 | 241 27 | 252 -1 | 89 16 | 46 4 | 43 12 |
| 2014-15 | 324 -258 | 251 -242 | 135 -106 | 116 -136 | 73 -16 | 43 -3 | 30 -13 |
| 2015-16 | 402 78 | 379 128 | 203 68 | 176 60 | 23 -50 | 17 -26 | 6 -24 |
| 2016-17 | 370 -32 | 342 -37 | 238 35 | 104 -72 | 28 5 | 14 -3 | 14 8 |
| 2017-18 | 304 -66 | 268 -74 | 181 -57 | 87 -17 | 36 8 | 8 -6 | 28 14 |
| 2018-19 | 298 -6 | 233 -35 | 157 -24 | 76 -11 | 65 29 | 31 23 | 34 6 |
| 2019-20 | 270 -28 | 229 -4 | 166 9 | 63 -13 | 41 -24 | 23 -8 | 18 -16 |
| 2020-21 | 244 -26 | 122 -107 | 83 -83 | 39 -24 | 122 81 | 55 32 | 67 49 |
| 2021-22 | 558 314 | 217 95 | 186 103 | 31 -8 | 341 219 | 138 83 | 203 136 |
| 2022-23 | 837 279 | 479 262 | 213 27 | 266 235 | 358 17 | 146 8 | 212 9 |
| Average | 430 | 316 | 183 | 133 | 114 | 51 | 62 |