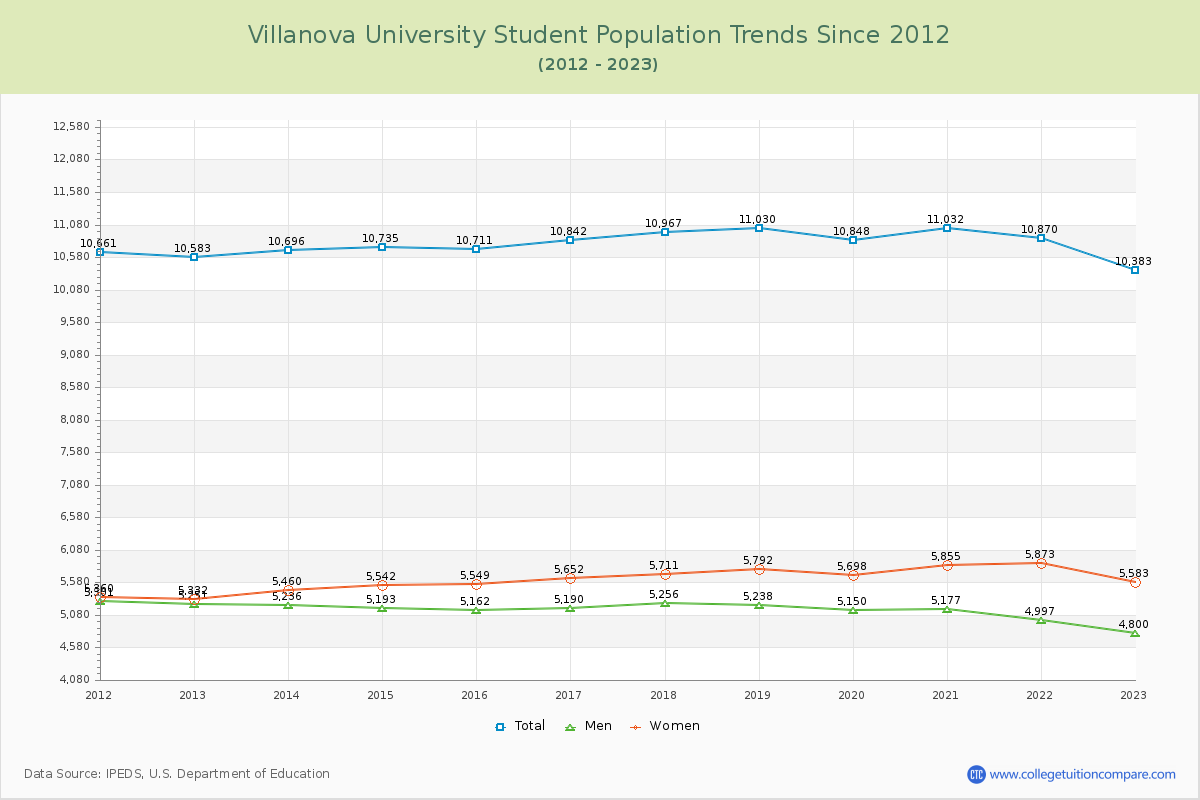
Student Population Changes
The average student population over the last 12 years is 10,791 where 10,383 students are attending the school for the academic year 2022-2023.
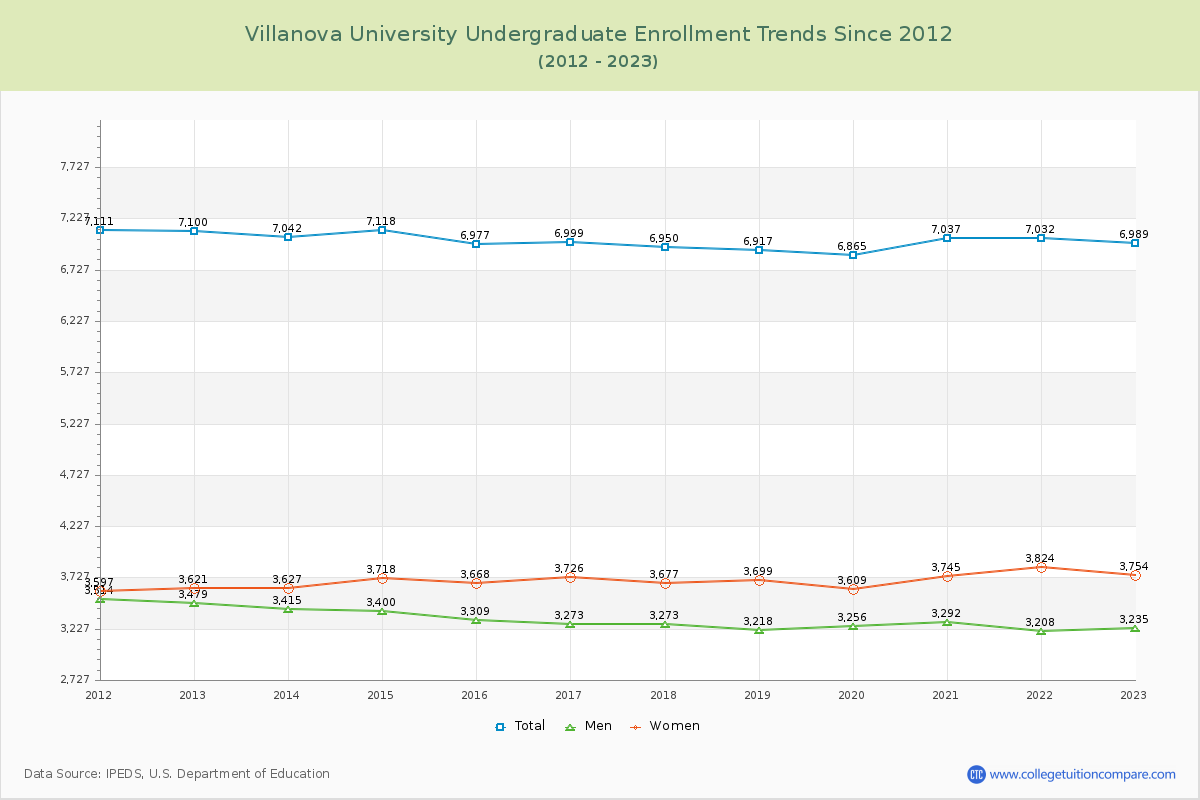
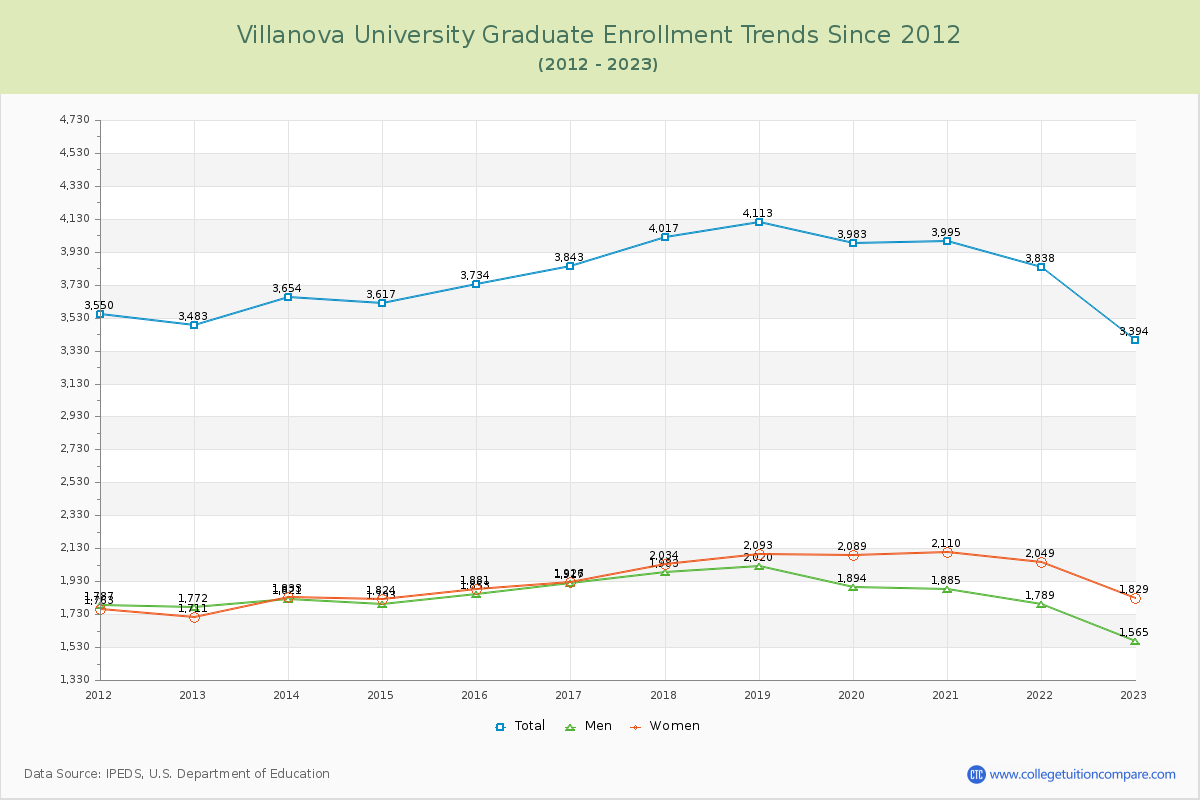
67.31% of total students is undergraduate students and 32.69% students is graduate students. The number of undergraduate students has decreased by 111 and the graduate enrollment has decreased by 89 over past 10 years.
The female to male ratio is 1.16 to 1 and it means that there are slightly more female students enrolled in Villanova than male students.
The following table and chart illustrate the changes in student population by gender at Villanova University since 2012.
| Year | Total | Undergraduate | Graduate | ||||
|---|---|---|---|---|---|---|---|
| Total | Men | Women | Total | Men | Women | ||
| 2012-13 | 10,583 | 7,100 | 3,479 | 3,621 | 3,483 | 1,772 | 1,711 |
| 2013-14 | 10,696 113 | 7,042 -58 | 3,415 -64 | 3,627 6 | 3,654 171 | 1,821 49 | 1,833 122 |
| 2014-15 | 10,735 39 | 7,118 76 | 3,400 -15 | 3,718 91 | 3,617 -37 | 1,793 -28 | 1,824 -9 |
| 2015-16 | 10,711 -24 | 6,977 -141 | 3,309 -91 | 3,668 -50 | 3,734 117 | 1,853 60 | 1,881 57 |
| 2016-17 | 10,842 131 | 6,999 22 | 3,273 -36 | 3,726 58 | 3,843 109 | 1,917 64 | 1,926 45 |
| 2017-18 | 10,967 125 | 6,950 -49 | 3,273 0 | 3,677 -49 | 4,017 174 | 1,983 66 | 2,034 108 |
| 2018-19 | 11,030 63 | 6,917 -33 | 3,218 -55 | 3,699 22 | 4,113 96 | 2,020 37 | 2,093 59 |
| 2019-20 | 10,848 -182 | 6,865 -52 | 3,256 38 | 3,609 -90 | 3,983 -130 | 1,894 -126 | 2,089 -4 |
| 2020-21 | 11,032 184 | 7,037 172 | 3,292 36 | 3,745 136 | 3,995 12 | 1,885 -9 | 2,110 21 |
| 2021-22 | 10,870 -162 | 7,032 -5 | 3,208 -84 | 3,824 79 | 3,838 -157 | 1,789 -96 | 2,049 -61 |
| 2022-23 | 10,383 -487 | 6,989 -43 | 3,235 27 | 3,754 -70 | 3,394 -444 | 1,565 -224 | 1,829 -220 |
| Average | 10,791 | 7,002 | 3,305 | 3,697 | 3,788 | 1,845 | 1,944 |