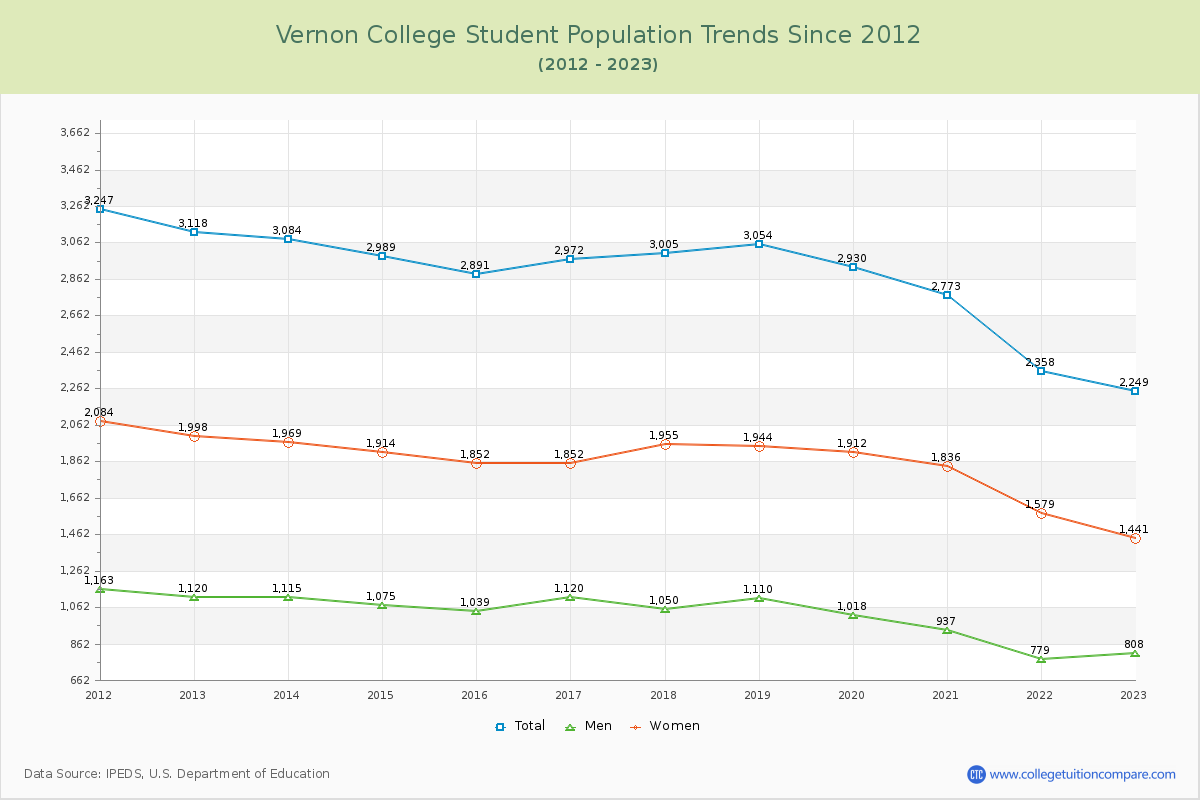
Student Population Changes
The average student population over the last 12 years is 2,857 where 2,249 students are attending the school for the academic year 2022-2023.
The female to male ratio is 1.78 to 1 and it means that there are more female students enrolled in VRJC than male students.
The following table and chart illustrate the changes in student population by gender at Vernon College since 2012.
| Year | Total | Men | Women |
|---|---|---|---|
| 2012-13 | 3,118 | 1,120 | 1,998 |
| 2013-14 | 3,084 -34 | 1,115 -5 | 1,969 -29 |
| 2014-15 | 2,989 -95 | 1,075 -40 | 1,914 -55 |
| 2015-16 | 2,891 -98 | 1,039 -36 | 1,852 -62 |
| 2016-17 | 2,972 81 | 1,120 81 | 1,852 0 |
| 2017-18 | 3,005 33 | 1,050 -70 | 1,955 103 |
| 2018-19 | 3,054 49 | 1,110 60 | 1,944 -11 |
| 2019-20 | 2,930 -124 | 1,018 -92 | 1,912 -32 |
| 2020-21 | 2,773 -157 | 937 -81 | 1,836 -76 |
| 2021-22 | 2,358 -415 | 779 -158 | 1,579 -257 |
| 2022-23 | 2,249 -109 | 808 29 | 1,441 -138 |
| Average | 2,857 | 1,016 | 1,841 |