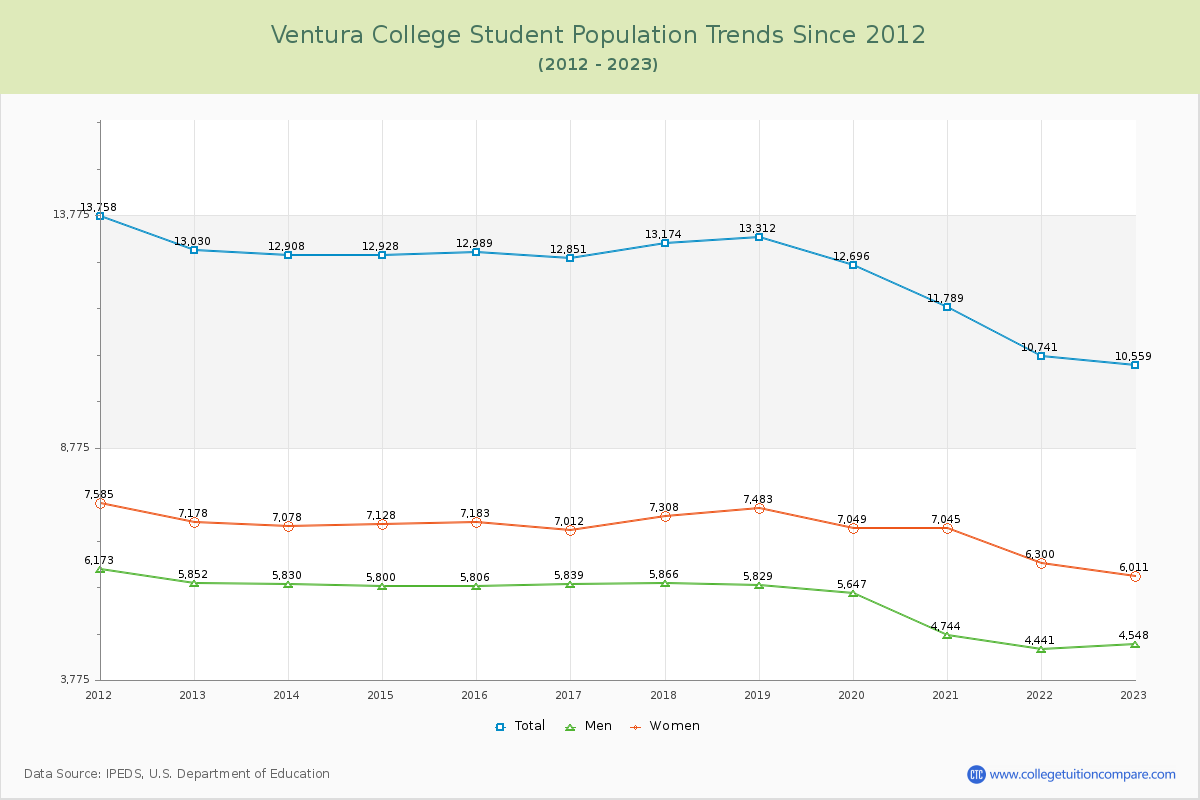
Student Population Changes
The average student population over the last 12 years is 12,452 where 10,559 students are attending the school for the academic year 2022-2023.
The female to male ratio is 1.32 to 1 and it means that there are more female students enrolled in Ventura than male students.
The following table and chart illustrate the changes in student population by gender at Ventura College since 2012.
| Year | Total | Men | Women |
|---|---|---|---|
| 2012-13 | 13,030 | 5,852 | 7,178 |
| 2013-14 | 12,908 -122 | 5,830 -22 | 7,078 -100 |
| 2014-15 | 12,928 20 | 5,800 -30 | 7,128 50 |
| 2015-16 | 12,989 61 | 5,806 6 | 7,183 55 |
| 2016-17 | 12,851 -138 | 5,839 33 | 7,012 -171 |
| 2017-18 | 13,174 323 | 5,866 27 | 7,308 296 |
| 2018-19 | 13,312 138 | 5,829 -37 | 7,483 175 |
| 2019-20 | 12,696 -616 | 5,647 -182 | 7,049 -434 |
| 2020-21 | 11,789 -907 | 4,744 -903 | 7,045 -4 |
| 2021-22 | 10,741 -1,048 | 4,441 -303 | 6,300 -745 |
| 2022-23 | 10,559 -182 | 4,548 107 | 6,011 -289 |
| Average | 12,452 | 5,473 | 6,980 |