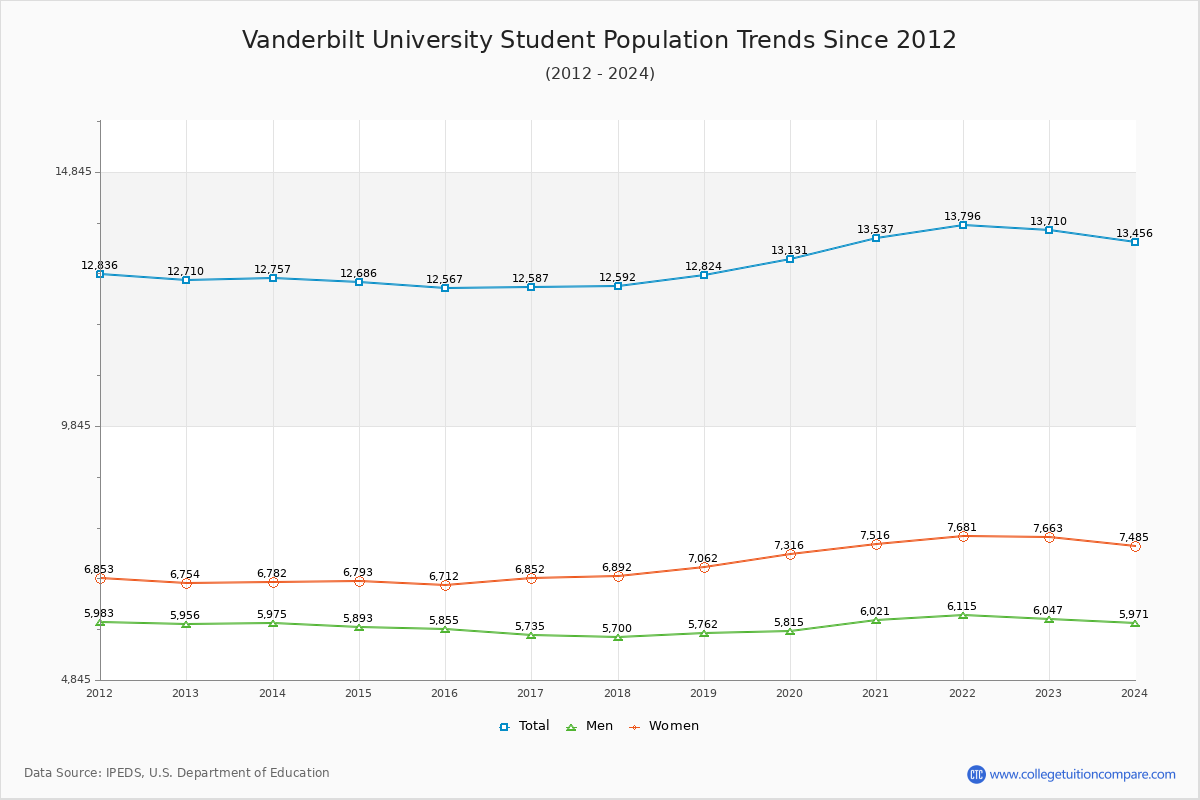
Student Population Changes
The average student population over the last 12 years is 12,991 where 13,710 students are attending the school for the academic year 2022-2023.
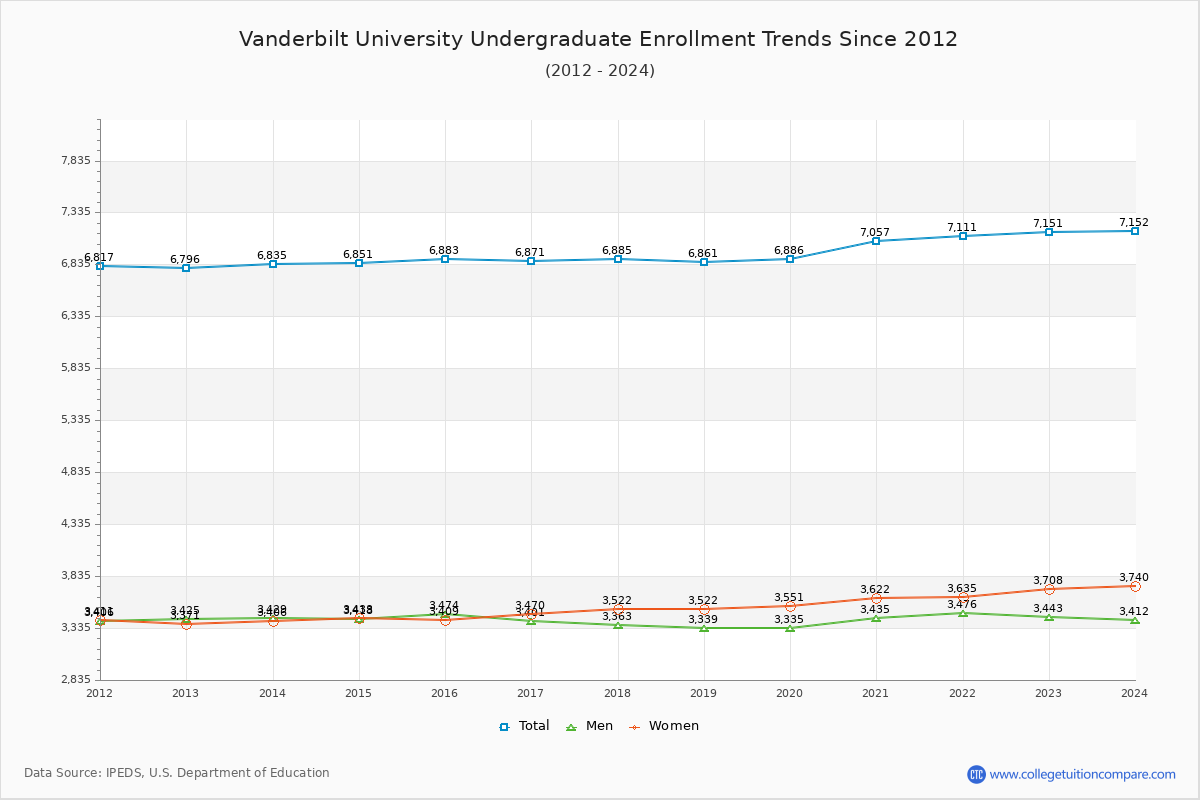
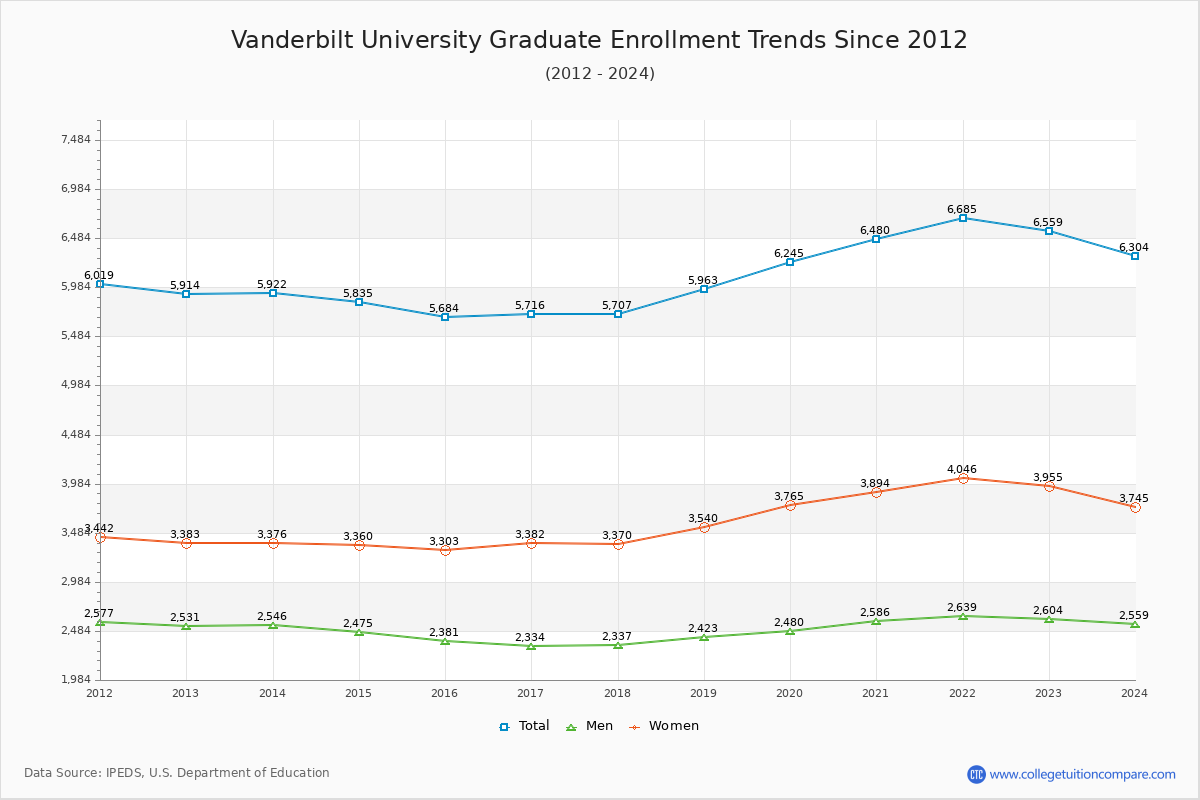
52.16% of total students is undergraduate students and 47.84% students is graduate students. The number of undergraduate students has increased by 355 and the graduate enrollment has increased by 645 over past 10 years.
The female to male ratio is 1.27 to 1 and it means that there are slightly more female students enrolled in Vanderbilt than male students.
The following table and chart illustrate the changes in student population by gender at Vanderbilt University since 2012.
| Year | Total | Undergraduate | Graduate | ||||
|---|---|---|---|---|---|---|---|
| Total | Men | Women | Total | Men | Women | ||
| 2012-13 | 12,710 | 6,796 | 3,425 | 3,371 | 5,914 | 2,531 | 3,383 |
| 2013-14 | 12,757 47 | 6,835 39 | 3,429 4 | 3,406 35 | 5,922 8 | 2,546 15 | 3,376 -7 |
| 2014-15 | 12,686 -71 | 6,851 16 | 3,418 -11 | 3,433 27 | 5,835 -87 | 2,475 -71 | 3,360 -16 |
| 2015-16 | 12,567 -119 | 6,883 32 | 3,474 56 | 3,409 -24 | 5,684 -151 | 2,381 -94 | 3,303 -57 |
| 2016-17 | 12,587 20 | 6,871 -12 | 3,401 -73 | 3,470 61 | 5,716 32 | 2,334 -47 | 3,382 79 |
| 2017-18 | 12,592 5 | 6,885 14 | 3,363 -38 | 3,522 52 | 5,707 -9 | 2,337 3 | 3,370 -12 |
| 2018-19 | 12,824 232 | 6,861 -24 | 3,339 -24 | 3,522 0 | 5,963 256 | 2,423 86 | 3,540 170 |
| 2019-20 | 13,131 307 | 6,886 25 | 3,335 -4 | 3,551 29 | 6,245 282 | 2,480 57 | 3,765 225 |
| 2020-21 | 13,537 406 | 7,057 171 | 3,435 100 | 3,622 71 | 6,480 235 | 2,586 106 | 3,894 129 |
| 2021-22 | 13,796 259 | 7,111 54 | 3,476 41 | 3,635 13 | 6,685 205 | 2,639 53 | 4,046 152 |
| 2022-23 | 13,710 -86 | 7,151 40 | 3,443 -33 | 3,708 73 | 6,559 -126 | 2,604 -35 | 3,955 -91 |
| Average | 12,991 | 6,926 | 3,413 | 3,514 | 6,065 | 2,485 | 3,579 |