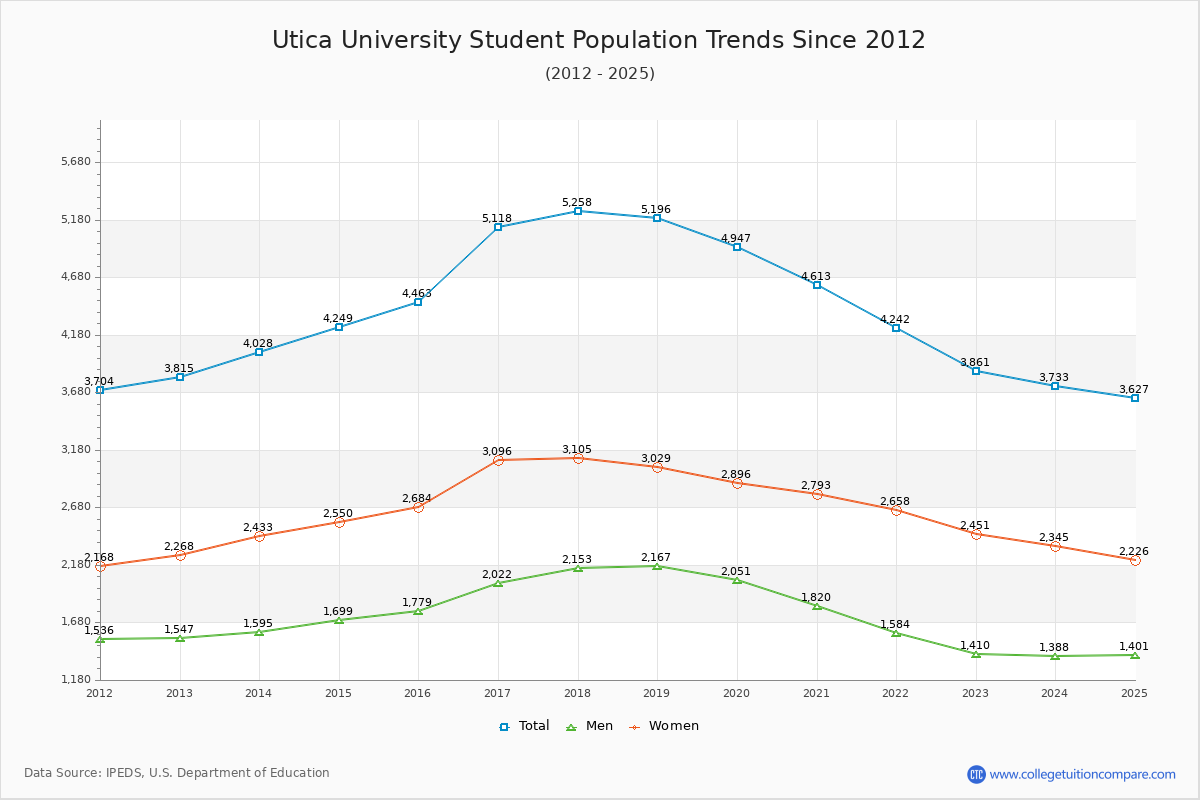
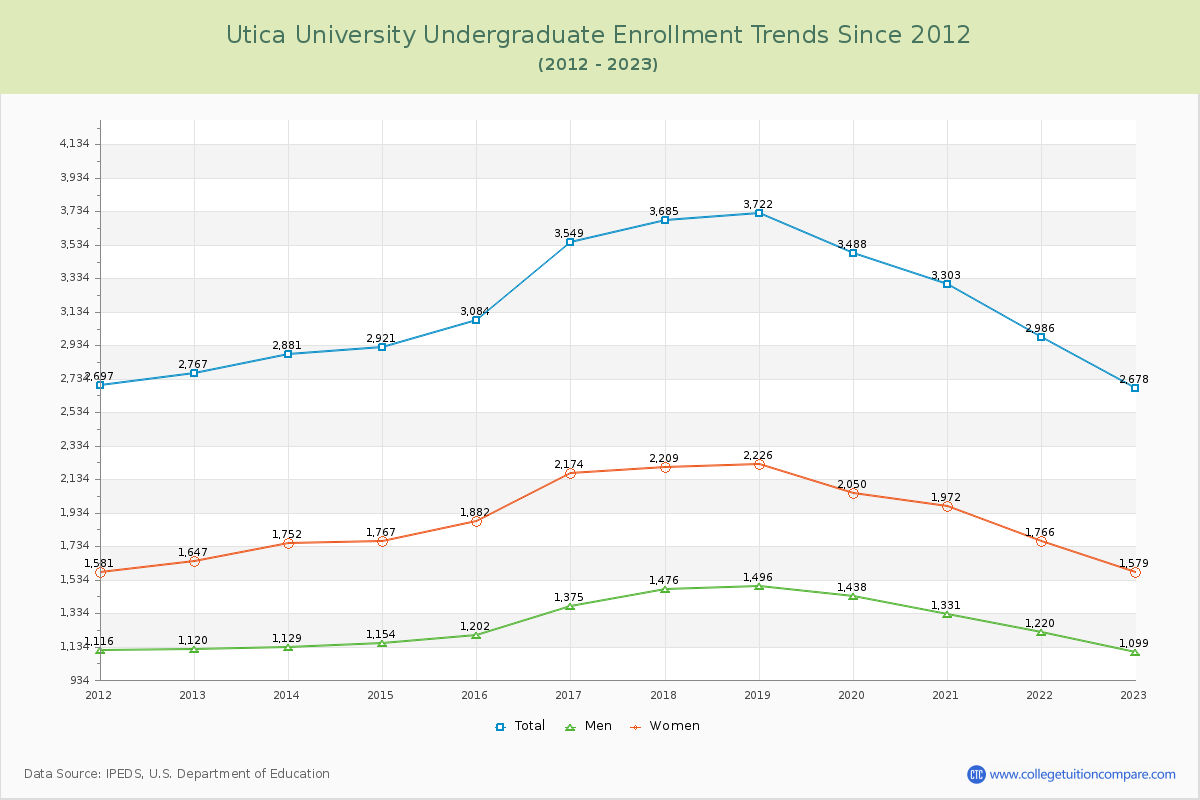
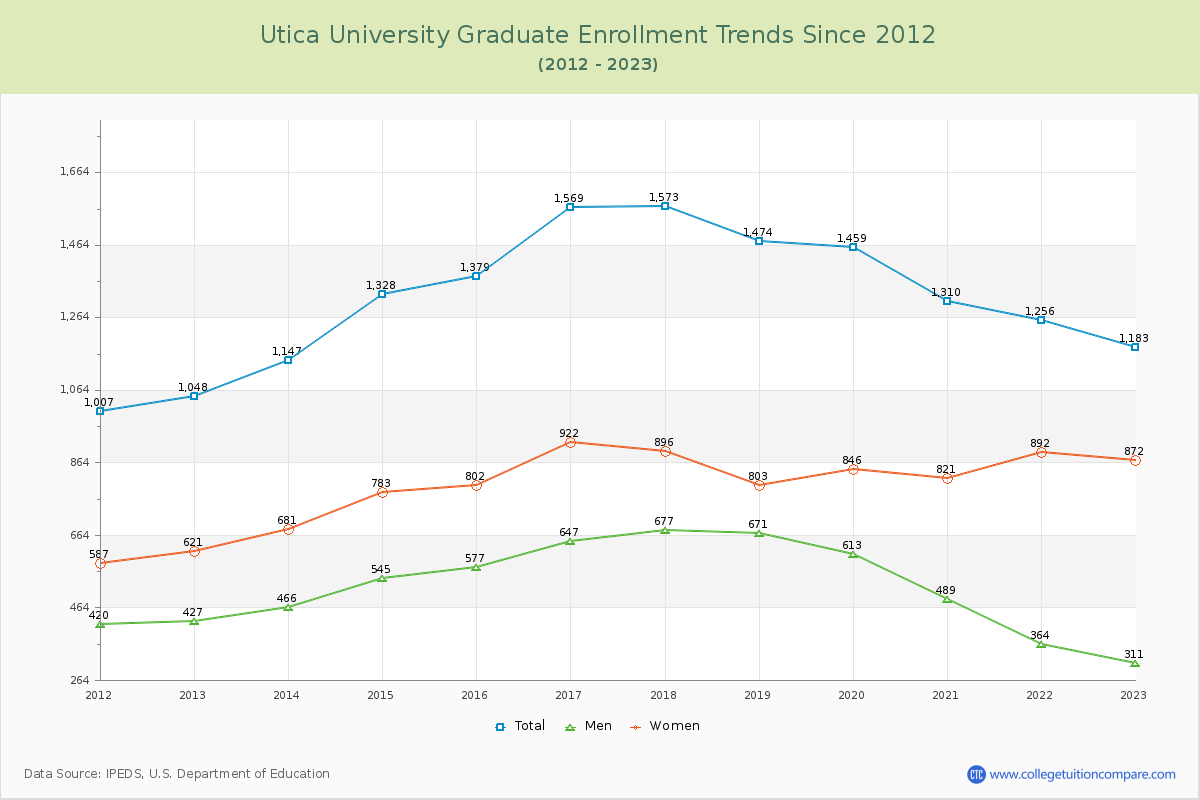
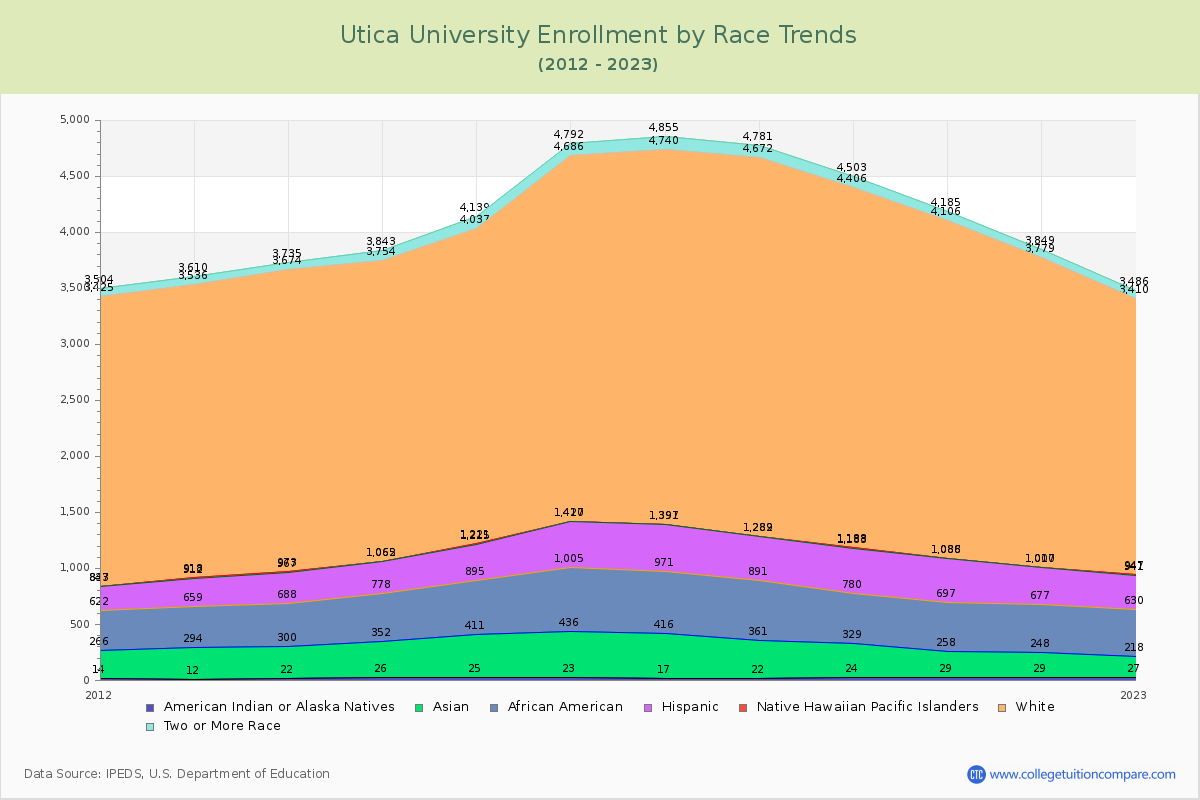
Student Population Changes
The average student population over the last 12 years is 4,526 where 3,861 students are attending the school for the academic year 2022-2023.
69.36% of total students is undergraduate students and 30.64% students is graduate students. The number of undergraduate students has decreased by 89 and the graduate enrollment has increased by 135 over past 10 years.
The female to male ratio is 1.74 to 1 and it means that there are more female students enrolled in Utica than male students.
The following table and chart illustrate the changes in student population by gender at Utica University since 2012.
| Year | Total | Undergraduate | Graduate | ||||
|---|---|---|---|---|---|---|---|
| Total | Men | Women | Total | Men | Women | ||
| 2012-13 | 3,815 | 2,767 | 1,120 | 1,647 | 1,048 | 427 | 621 |
| 2013-14 | 4,028 213 | 2,881 114 | 1,129 9 | 1,752 105 | 1,147 99 | 466 39 | 681 60 |
| 2014-15 | 4,249 221 | 2,921 40 | 1,154 25 | 1,767 15 | 1,328 181 | 545 79 | 783 102 |
| 2015-16 | 4,463 214 | 3,084 163 | 1,202 48 | 1,882 115 | 1,379 51 | 577 32 | 802 19 |
| 2016-17 | 5,118 655 | 3,549 465 | 1,375 173 | 2,174 292 | 1,569 190 | 647 70 | 922 120 |
| 2017-18 | 5,258 140 | 3,685 136 | 1,476 101 | 2,209 35 | 1,573 4 | 677 30 | 896 -26 |
| 2018-19 | 5,196 -62 | 3,722 37 | 1,496 20 | 2,226 17 | 1,474 -99 | 671 -6 | 803 -93 |
| 2019-20 | 4,947 -249 | 3,488 -234 | 1,438 -58 | 2,050 -176 | 1,459 -15 | 613 -58 | 846 43 |
| 2020-21 | 4,613 -334 | 3,303 -185 | 1,331 -107 | 1,972 -78 | 1,310 -149 | 489 -124 | 821 -25 |
| 2021-22 | 4,242 -371 | 2,986 -317 | 1,220 -111 | 1,766 -206 | 1,256 -54 | 364 -125 | 892 71 |
| 2022-23 | 3,861 -381 | 2,678 -308 | 1,099 -121 | 1,579 -187 | 1,183 -73 | 311 -53 | 872 -20 |
| Average | 4,526 | 3,188 | 1,276 | 1,911 | 1,339 | 526 | 813 |