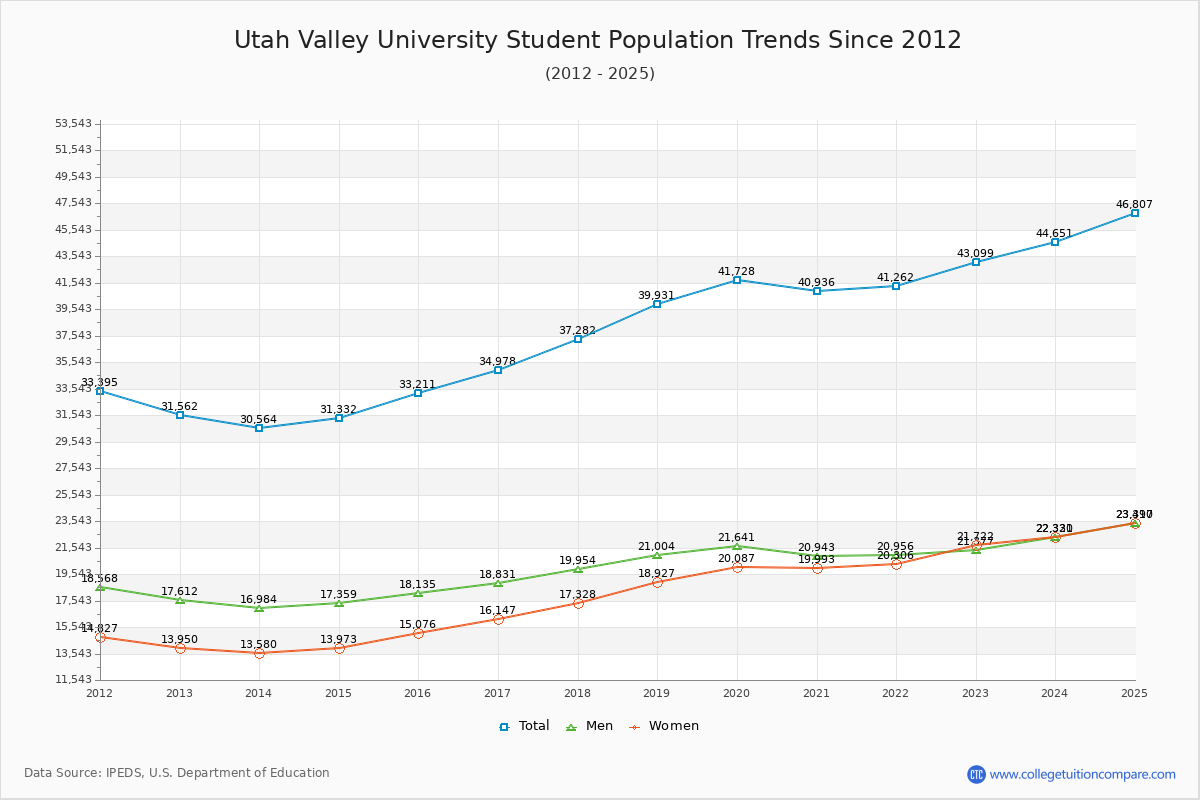
Student Population Changes
The average student population over the last 12 years is 36,899 where 43,099 students are attending the school for the academic year 2022-2023.
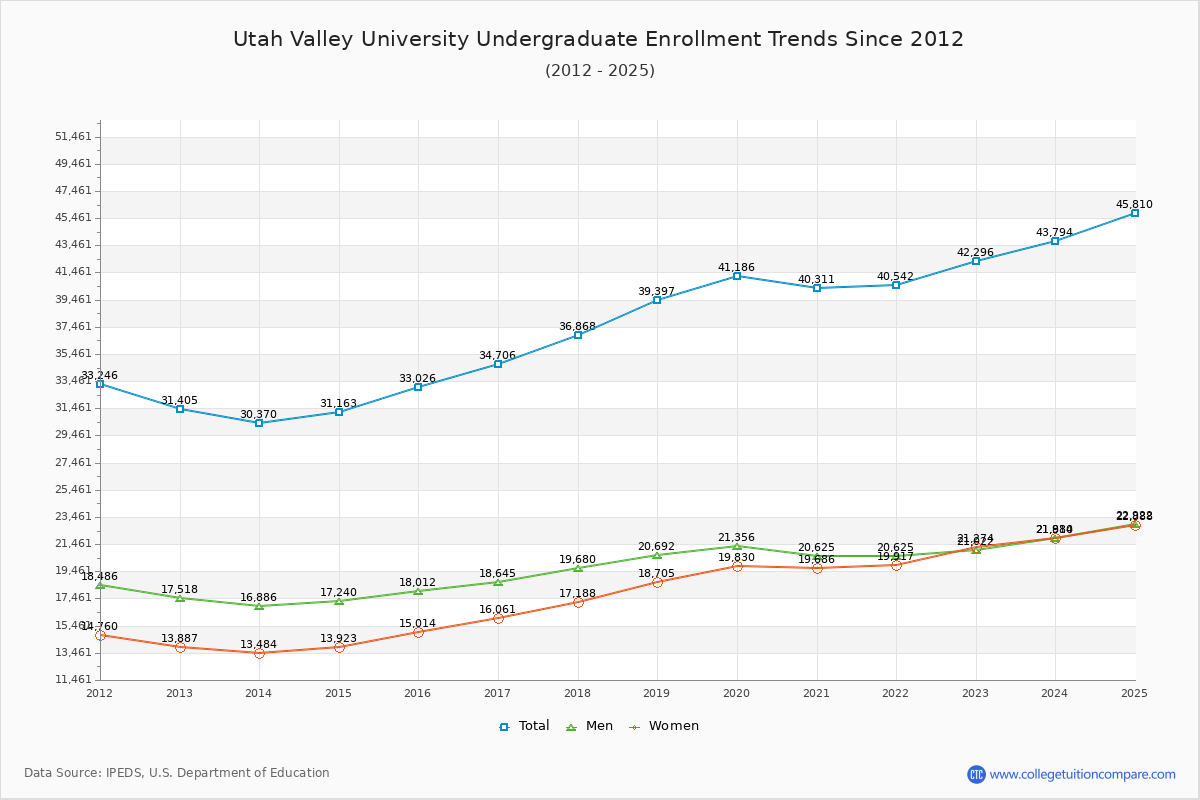
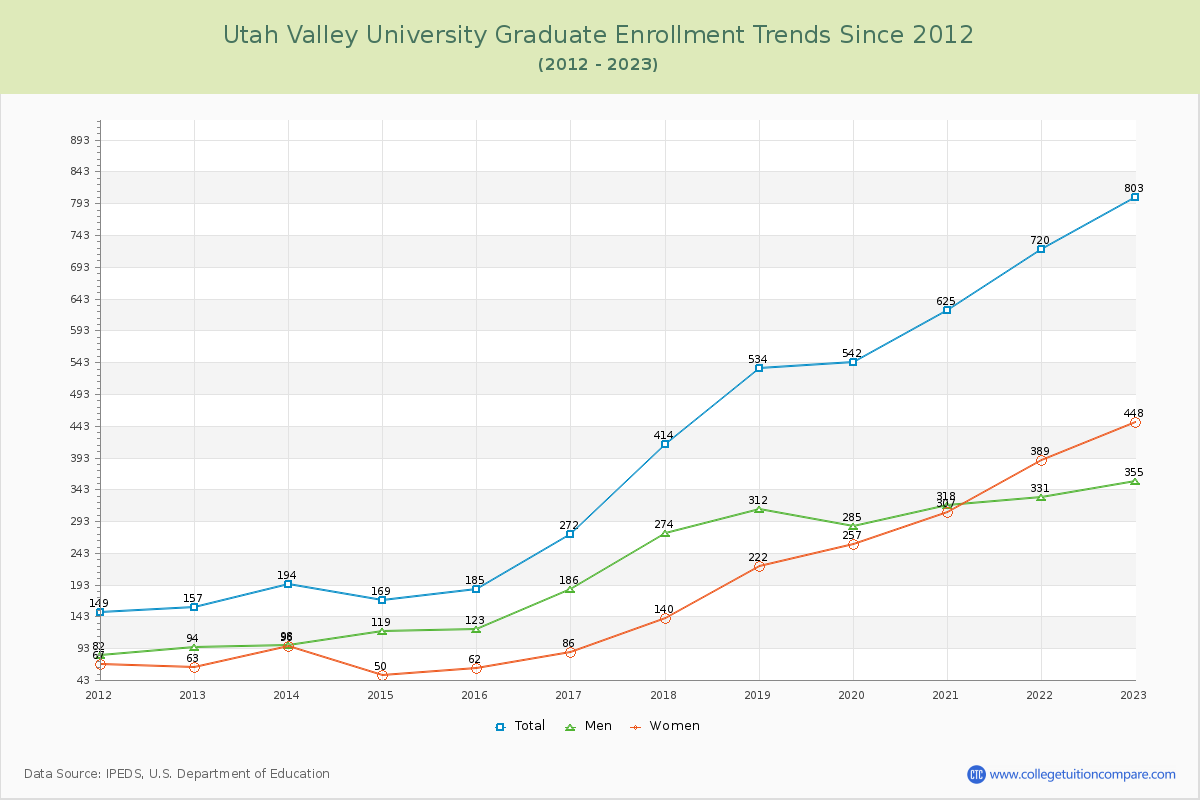
98.14% of total students is undergraduate students and 1.86% students is graduate students. The number of undergraduate students has increased by 10,891 and the graduate enrollment has increased by 646 over past 10 years.
The female to male ratio is 1.02 to 1 and it means that there are similar numbers of female and male students enrolled in UVU.
The following table and chart illustrate the changes in student population by gender at Utah Valley University since 2012.
| Year | Total | Undergraduate | Graduate | ||||
|---|---|---|---|---|---|---|---|
| Total | Men | Women | Total | Men | Women | ||
| 2012-13 | 31,562 | 31,405 | 17,518 | 13,887 | 157 | 94 | 63 |
| 2013-14 | 30,564 -998 | 30,370 -1,035 | 16,886 -632 | 13,484 -403 | 194 37 | 98 4 | 96 33 |
| 2014-15 | 31,332 768 | 31,163 793 | 17,240 354 | 13,923 439 | 169 -25 | 119 21 | 50 -46 |
| 2015-16 | 33,211 1,879 | 33,026 1,863 | 18,012 772 | 15,014 1,091 | 185 16 | 123 4 | 62 12 |
| 2016-17 | 34,978 1,767 | 34,706 1,680 | 18,645 633 | 16,061 1,047 | 272 87 | 186 63 | 86 24 |
| 2017-18 | 37,282 2,304 | 36,868 2,162 | 19,680 1,035 | 17,188 1,127 | 414 142 | 274 88 | 140 54 |
| 2018-19 | 39,931 2,649 | 39,397 2,529 | 20,692 1,012 | 18,705 1,517 | 534 120 | 312 38 | 222 82 |
| 2019-20 | 41,728 1,797 | 41,186 1,789 | 21,356 664 | 19,830 1,125 | 542 8 | 285 -27 | 257 35 |
| 2020-21 | 40,936 -792 | 40,311 -875 | 20,625 -731 | 19,686 -144 | 625 83 | 318 33 | 307 50 |
| 2021-22 | 41,262 326 | 40,542 231 | 20,625 0 | 19,917 231 | 720 95 | 331 13 | 389 82 |
| 2022-23 | 43,099 1,837 | 42,296 1,754 | 21,022 397 | 21,274 1,357 | 803 83 | 355 24 | 448 59 |
| Average | 36,899 | 36,479 | 19,300 | 17,179 | 420 | 227 | 193 |