Enrollment Trends at WSCC

120

Total Enrollment

-83

Men

203

Women

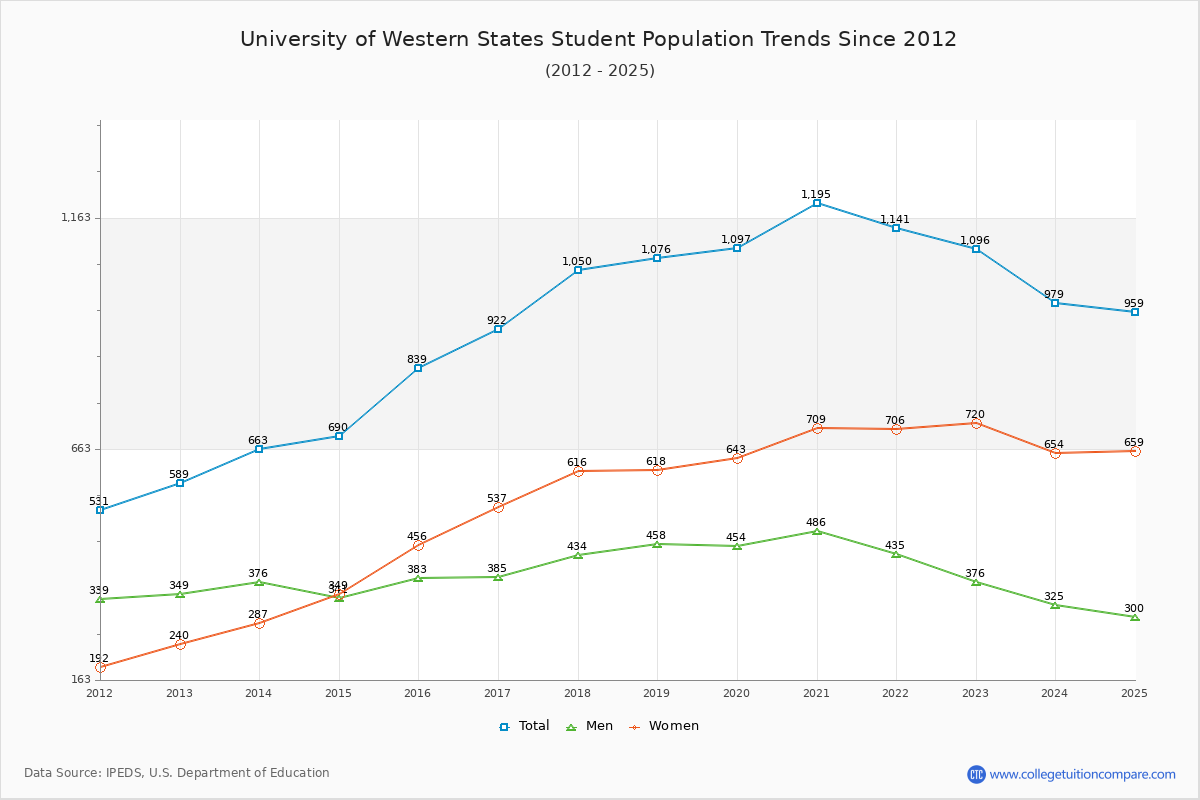
The student population at University of Western States is 959 (2 undergraduate and 959 graduate students) . The number of students has increased by 120 over the past decade.

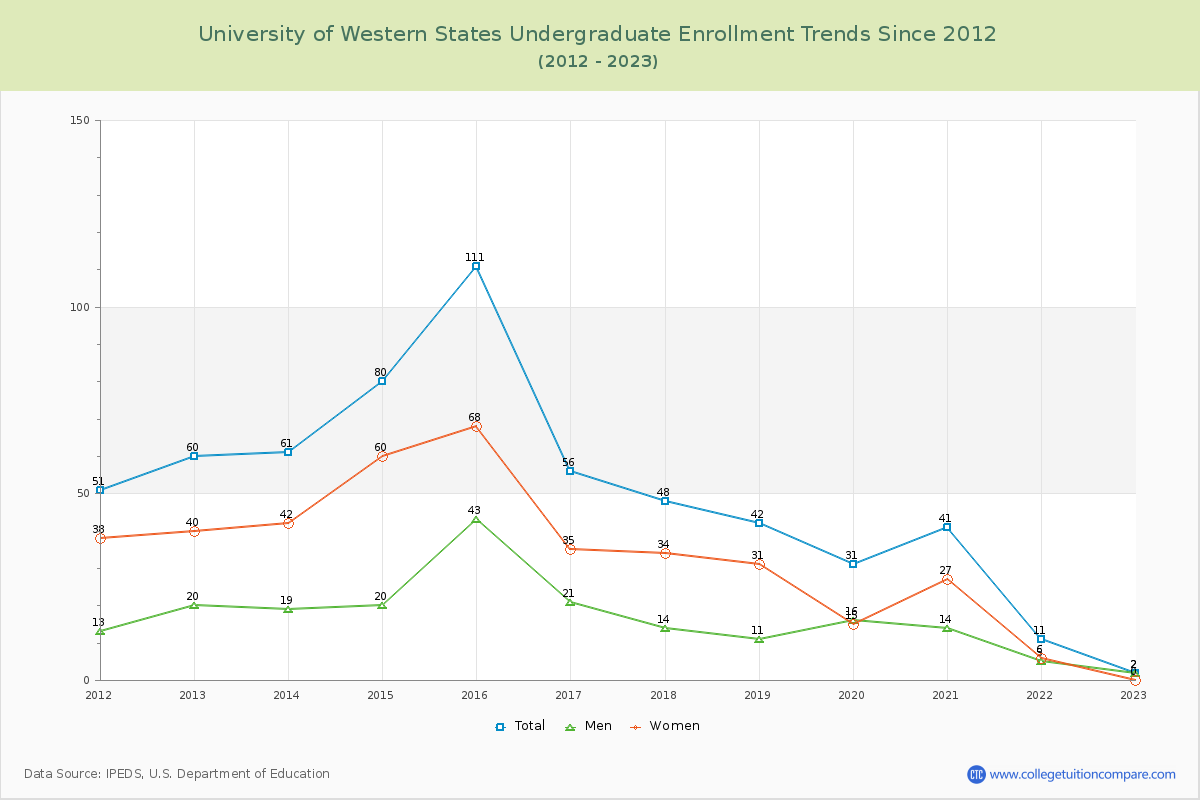
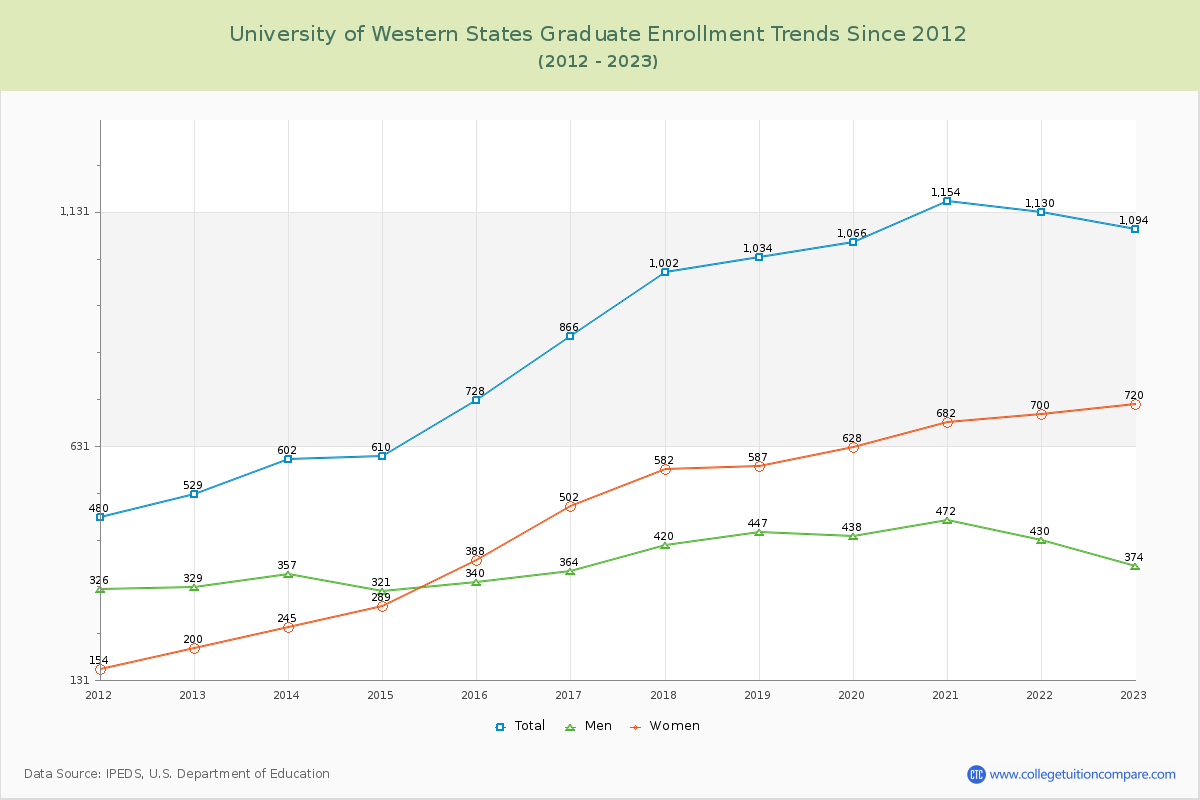
The percentage of undergraduate students at WSCC is 0.21% which is decreased by 109 over last 10 years. The graduate student population increased by 231 and it has been increasing.

The female to male ratio is 2.20 to 1 which means that majority of population is on female students.

587 students enrolled in online degree program exclusively and the number of online students has increased by 86.94% since 2015.

Student Population Changes

The average student population over the last 11 years is 1,035 where 959 students are attending the school for the academic year 2024-2025.

0.21% of total students is undergraduate students and 100.00% students is graduate students. The number of undergraduate students has decreased by 109 and the graduate enrollment has increased by 231 over past 10 years.

The female to male ratio is 2.20 to 1 and it means that there are far more female students enrolled in WSCC than male students.

The following table and chart illustrate the changes in student population by gender at University of Western States since 2015.

YearTotalUndergraduateGraduate
TotalMenWomenTotalMenWomen
2015-168391114368728340388
2016-17922
83
56
-55
21
-22
35
-33
866
138
364
24
502
114
2017-181,050
128
48
-8
14
-7
34
-1
1,002
136
420
56
582
80
2018-191,076
26
42
-6
11
-3
31
-3
1,034
32
447
27
587
5
2019-201,097
21
31
-11
16
5
15
-16
1,066
32
438
-9
628
41
2020-211,195
98
41
10
14
-2
27
12
1,154
88
472
34
682
54
2021-221,141
-54
11
-30
5
-9
6
-21
1,130
-24
430
-42
700
18
2022-231,096
-45
2
-9
2
-3
0
-6
1,094
-36
374
-56
720
20
2023-24979
-117
0
-2
0
-2
0979
-115
325
-49
654
-66
2024-25959
-20
000959
-20
300
-25
659
5
Average1,0353413221,001391610
University of Western States Enrollment Trends Chart

Undergraduate Enrollment Changes

The average number of Undergraduate students over the last 11 years is 34 where 0 students are attending the Undergraduate school for the academic year 2024-2025. The following table and chart illustrate the changes in Undergraduate enrollment by attending status and gender at University of Western States since 2015.

YearTotalMenWomen
2015-161110001114368
2016-1756000562135
2017-1848000481434
2018-1942000421131
2019-2031000311615
2020-2141000411427
2021-22110001156
2022-232000220
2023-240000000
2024-250000000
Average343400341322
University of Western States Undergraduate Enrollment Trends Chart

Graduate Enrollment Changes

The average number of Graduate students over the last 11 years is 1,001 where 959 students are attending the Graduate school for the academic year 2024-2025. The following table and chart illustrate the changes in Graduate enrollment by attending status and gender at University of Western States since 2015.

YearTotalFull-timePart-time
TotalMenWomenTotalMenWomen
2015-1672846227918326661205
2016-17866793354439731063
2017-181,0028883984901142292
2018-191,034576338238458109349
2019-201,066572324248494114380
2020-211,154609314295545158387
2021-221,130582294288548136412
2022-231,094517241276577133444
2023-24979390189201589136453
2024-25959423181242536119417
Average1,0011,0012912901,001100320
University of Western States Graduate Enrollment Trends Chart

Enrollment by Race/Ethnicity Changes

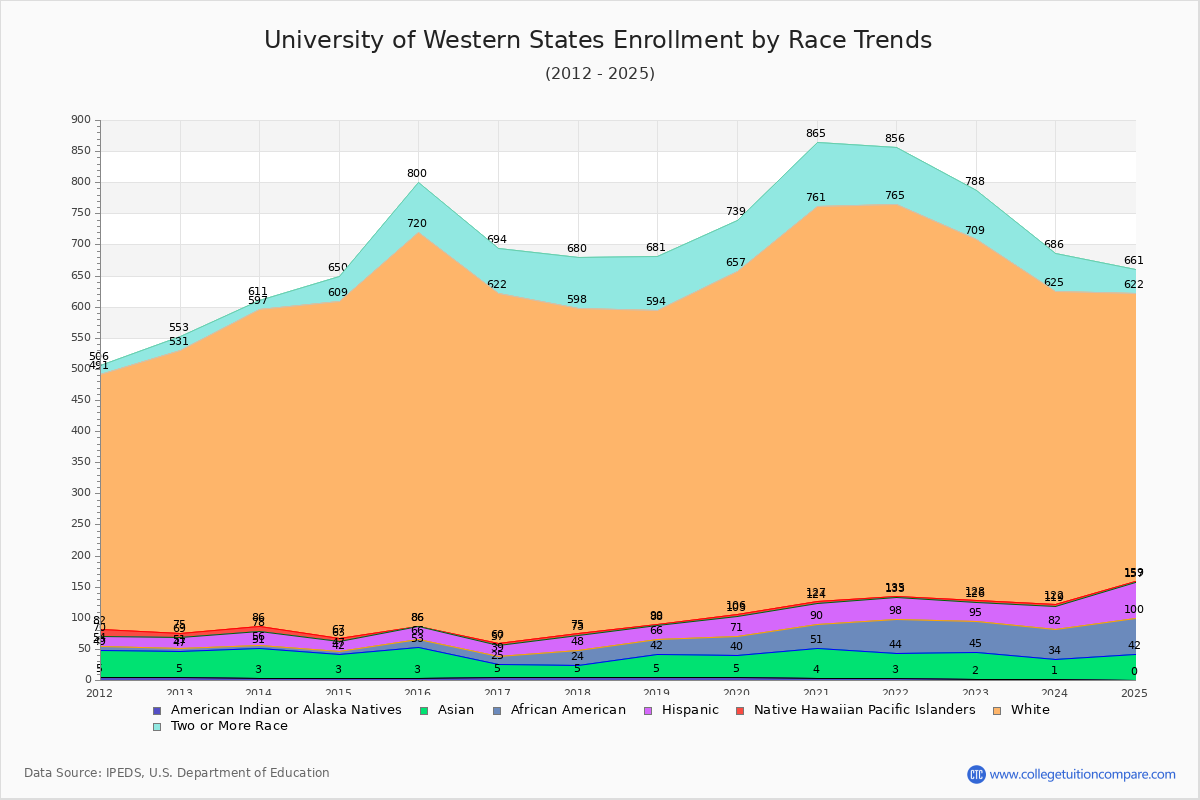
The percentage of white students is 48.28% and the percentage of black students is 6.05% at University of Western States. 4.38% of enrolled students is Asian. Hispanic students comprise 5.94% of the student body.

Over the past 10 years, the racial composition has shifted. The percentage of white students decreased from 75.57% to 48.28%. Asian enrollment declined from 5.96% to 4.38%. Black student enrollment increased from 1.55% to 6.05%. Hispanic student representation expanded from 2.38% to 5.94%.

The overall racial diversity, measured by the Census Bureau Diversity Index, is 0.7561 which indicates that quite diverse. This increased from 0.4155 a decade ago, suggesting that racial diversity has improved.

The following table and chart illustrate the student population trends by race/ethnicity at University of Western States over the past 11 years (2015-2025).

YearAmerican Indian or Native AmericanAsianBlackHispanicNative Hawaiian or Other Pacific IslanderWhiteTwo or More Races
2015-163501320063480
2016-175201418356272
2017-185192425252382
2018-195372422250487
2019-205353132355182
2020-2144739343634104
2021-223415435263091
2022-232435031258179
2023-241334837350361
2024-250425857246339
Average3373631255978
University of Western States Enrollment by Race Trends Chart

Distance Learning (Online Courses) Enrollment Changes

587 students are enrolled in online degree programs exclusively for the academic year 2024-2025, which is 61% of total students. The number of online students has increased 86.94% since 2015. The following table and chart illustrate the changes in the online student population by enrolled type at University of Western States from 2015 to 2025.

YearTotal EnrollmentOnline CompletelyEnrolled in Some Online CoursesNot Enrolled in Online Courses
2015-168393140525
2016-179224720450
2017-181,0505400510
2018-191,0765290547
2019-201,0975700527
2020-211,195679144372
2021-221,1416465490
2022-231,09661829449
2023-249795670412
2024-2595958732052
Average1,03555250433

Ratings & Review

Share your experiences and thoughts about University of Western States. It will be a great help to applicants and prospective students!