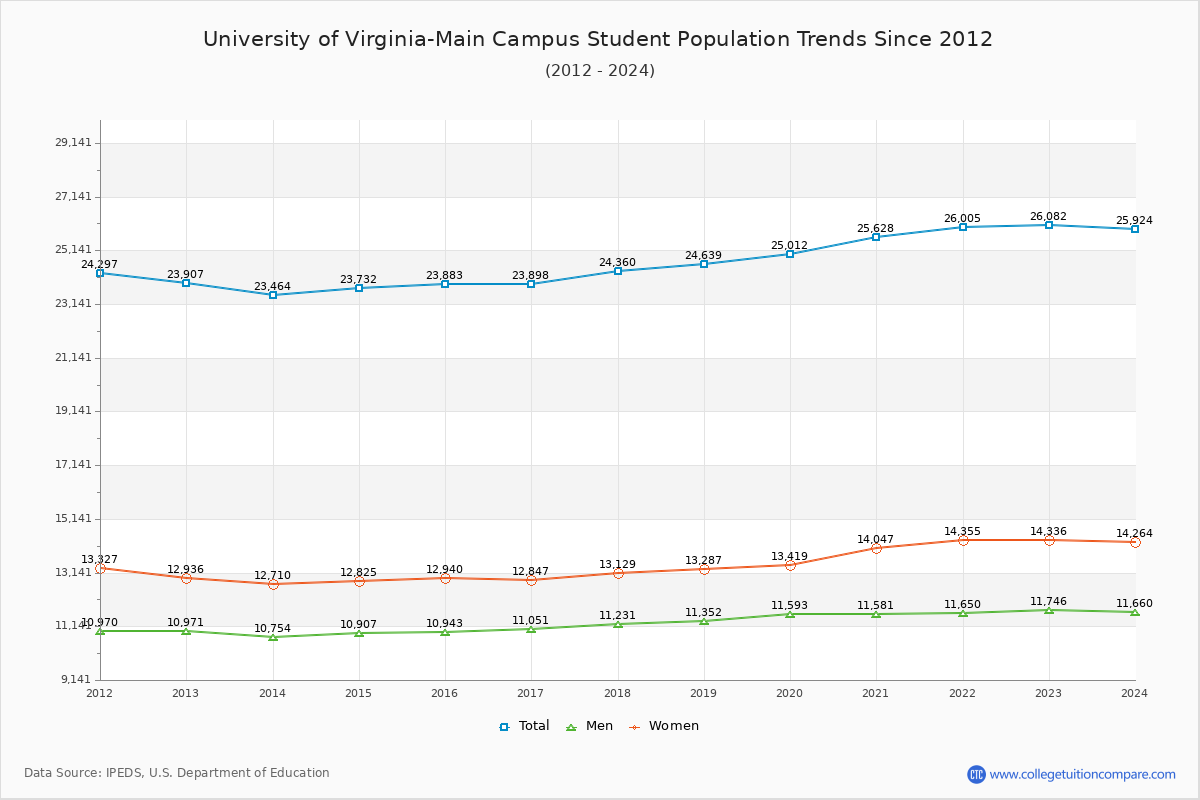
Student Population Changes
The average student population over the last 12 years is 24,601 where 26,082 students are attending the school for the academic year 2022-2023.
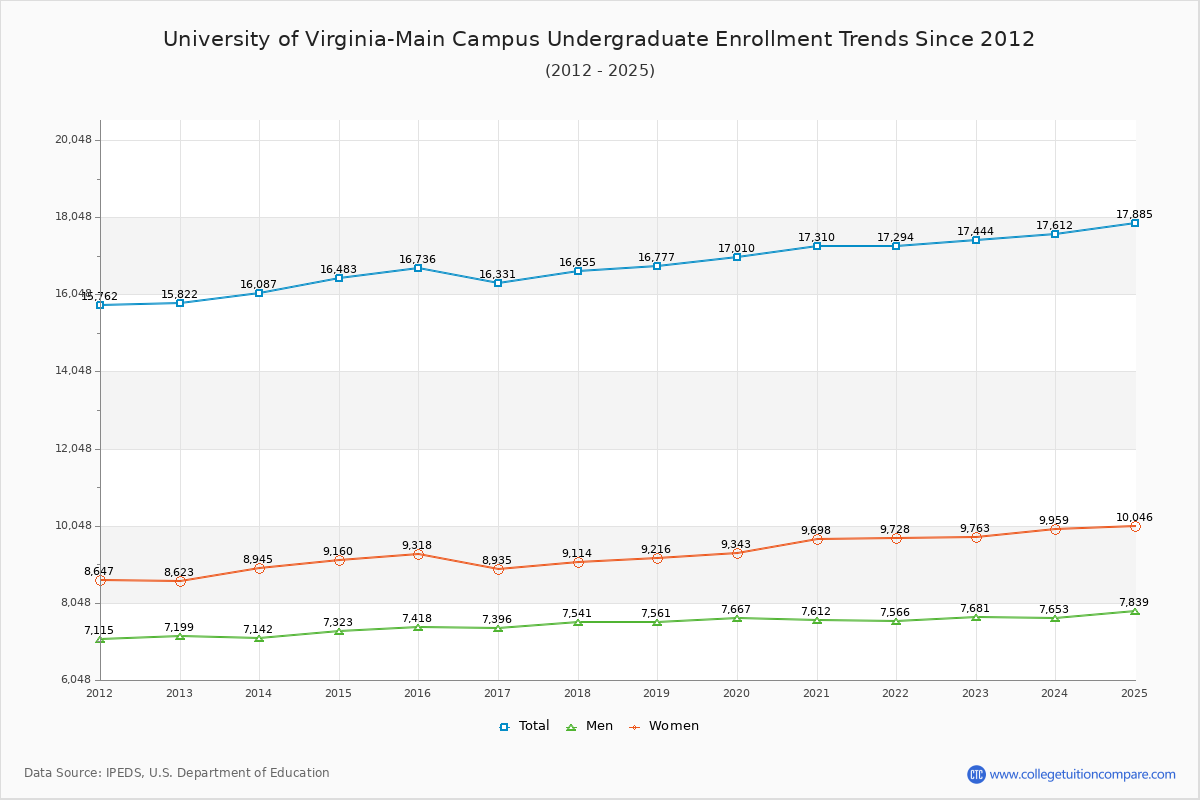
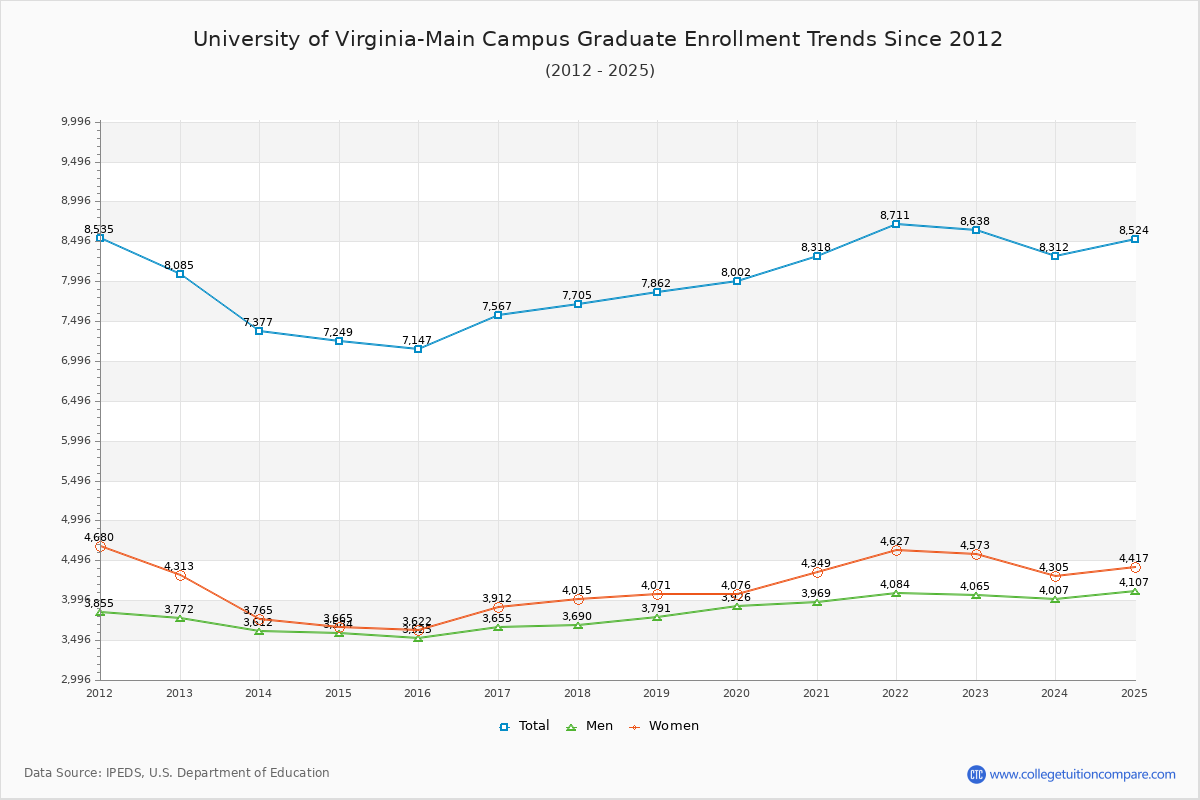
66.88% of total students is undergraduate students and 33.12% students is graduate students. The number of undergraduate students has increased by 1,622 and the graduate enrollment has increased by 553 over past 10 years.
The female to male ratio is 1.22 to 1 and it means that there are slightly more female students enrolled in UVA than male students.
The following table and chart illustrate the changes in student population by gender at University of Virginia-Main Campus since 2012.
| Year | Total | Undergraduate | Graduate | ||||
|---|---|---|---|---|---|---|---|
| Total | Men | Women | Total | Men | Women | ||
| 2012-13 | 23,907 | 15,822 | 7,199 | 8,623 | 8,085 | 3,772 | 4,313 |
| 2013-14 | 23,464 -443 | 16,087 265 | 7,142 -57 | 8,945 322 | 7,377 -708 | 3,612 -160 | 3,765 -548 |
| 2014-15 | 23,732 268 | 16,483 396 | 7,323 181 | 9,160 215 | 7,249 -128 | 3,584 -28 | 3,665 -100 |
| 2015-16 | 23,883 151 | 16,736 253 | 7,418 95 | 9,318 158 | 7,147 -102 | 3,525 -59 | 3,622 -43 |
| 2016-17 | 23,898 15 | 16,331 -405 | 7,396 -22 | 8,935 -383 | 7,567 420 | 3,655 130 | 3,912 290 |
| 2017-18 | 24,360 462 | 16,655 324 | 7,541 145 | 9,114 179 | 7,705 138 | 3,690 35 | 4,015 103 |
| 2018-19 | 24,639 279 | 16,777 122 | 7,561 20 | 9,216 102 | 7,862 157 | 3,791 101 | 4,071 56 |
| 2019-20 | 25,012 373 | 17,010 233 | 7,667 106 | 9,343 127 | 8,002 140 | 3,926 135 | 4,076 5 |
| 2020-21 | 25,628 616 | 17,310 300 | 7,612 -55 | 9,698 355 | 8,318 316 | 3,969 43 | 4,349 273 |
| 2021-22 | 26,005 377 | 17,294 -16 | 7,566 -46 | 9,728 30 | 8,711 393 | 4,084 115 | 4,627 278 |
| 2022-23 | 26,082 77 | 17,444 150 | 7,681 115 | 9,763 35 | 8,638 -73 | 4,065 -19 | 4,573 -54 |
| Average | 24,601 | 16,723 | 7,464 | 9,258 | 7,878 | 3,788 | 4,090 |