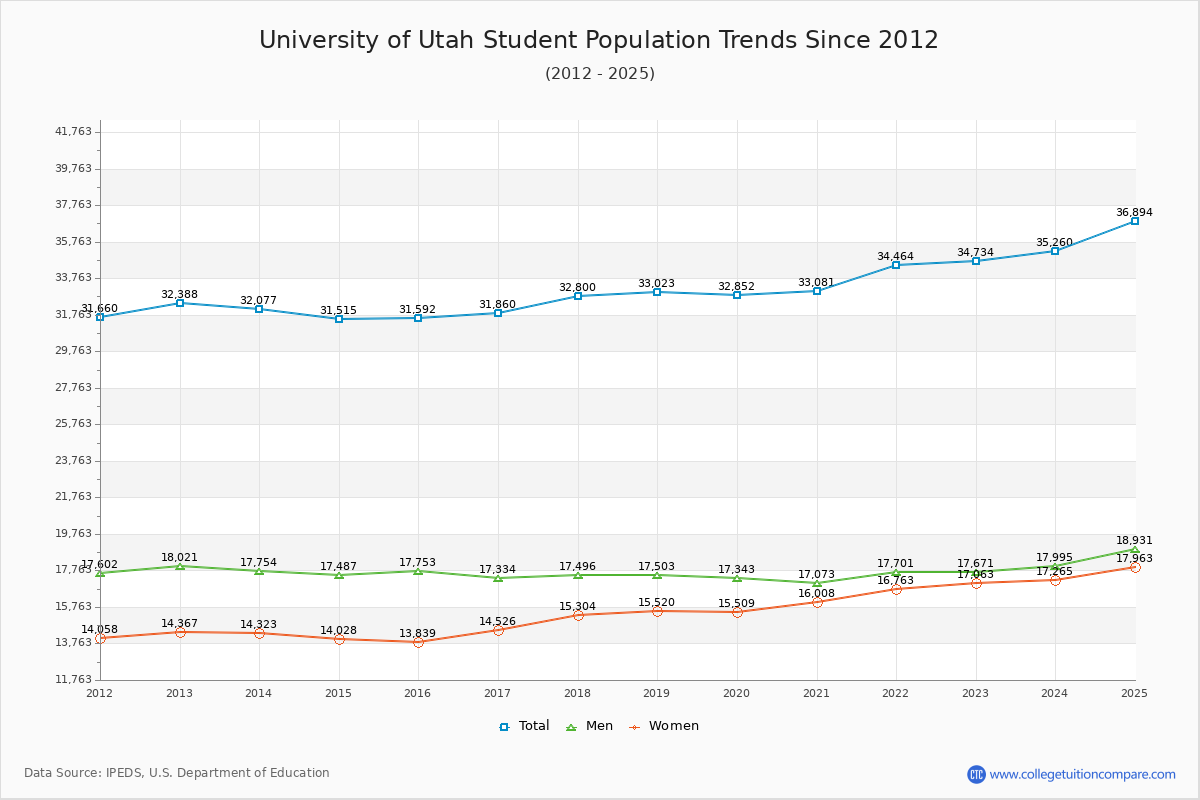
Student Population Changes
The average student population over the last 12 years is 32,762 where 34,734 students are attending the school for the academic year 2022-2023.
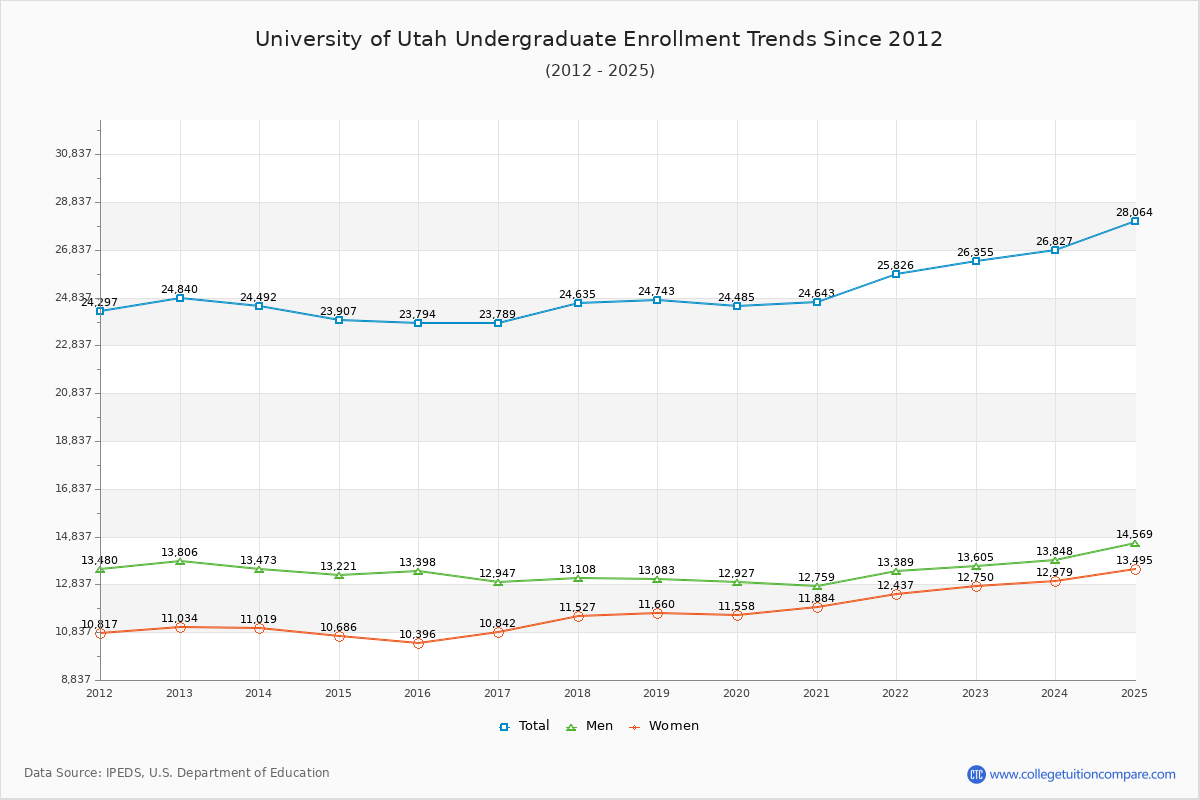
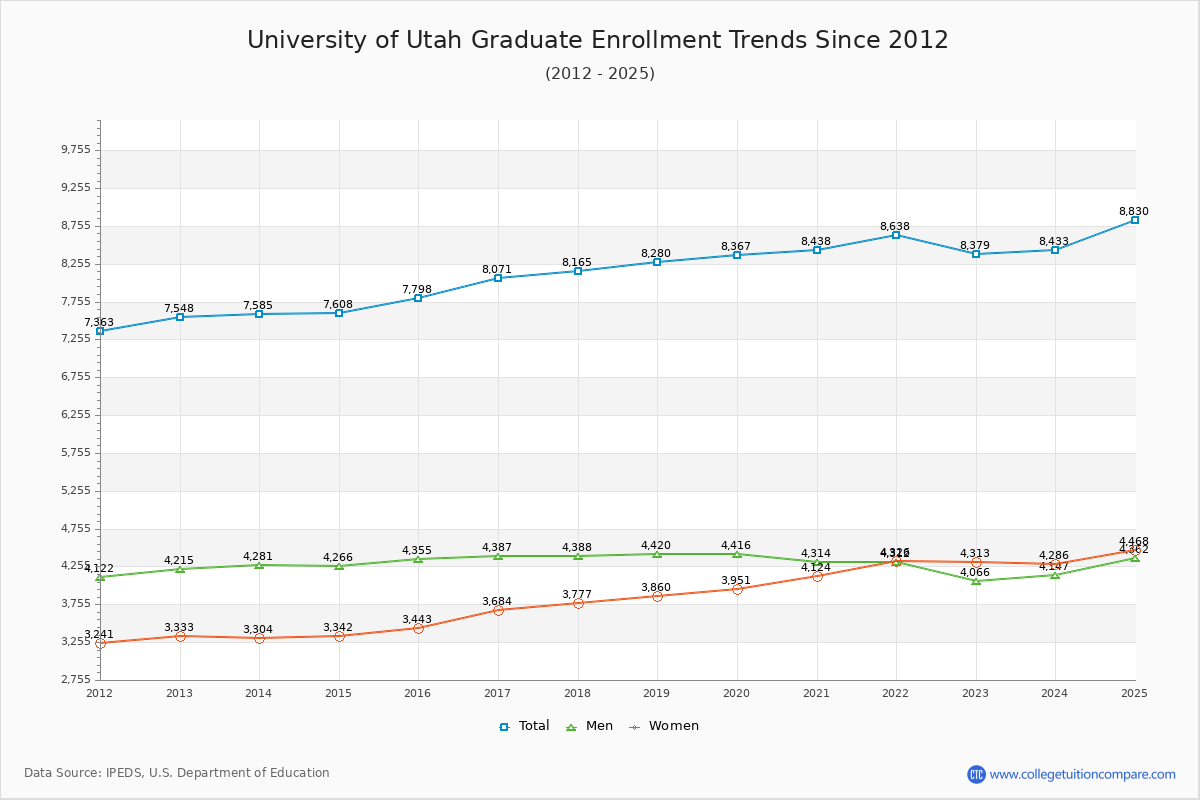
75.88% of total students is undergraduate students and 24.12% students is graduate students. The number of undergraduate students has increased by 1,515 and the graduate enrollment has increased by 831 over past 10 years.
The female to male ratio is 0.97 to 1 and it means that there are similar numbers of female and male students enrolled in The U.
The following table and chart illustrate the changes in student population by gender at University of Utah since 2012.
| Year | Total | Undergraduate | Graduate | ||||
|---|---|---|---|---|---|---|---|
| Total | Men | Women | Total | Men | Women | ||
| 2012-13 | 32,388 | 24,840 | 13,806 | 11,034 | 7,548 | 4,215 | 3,333 |
| 2013-14 | 32,077 -311 | 24,492 -348 | 13,473 -333 | 11,019 -15 | 7,585 37 | 4,281 66 | 3,304 -29 |
| 2014-15 | 31,515 -562 | 23,907 -585 | 13,221 -252 | 10,686 -333 | 7,608 23 | 4,266 -15 | 3,342 38 |
| 2015-16 | 31,592 77 | 23,794 -113 | 13,398 177 | 10,396 -290 | 7,798 190 | 4,355 89 | 3,443 101 |
| 2016-17 | 31,860 268 | 23,789 -5 | 12,947 -451 | 10,842 446 | 8,071 273 | 4,387 32 | 3,684 241 |
| 2017-18 | 32,800 940 | 24,635 846 | 13,108 161 | 11,527 685 | 8,165 94 | 4,388 1 | 3,777 93 |
| 2018-19 | 33,023 223 | 24,743 108 | 13,083 -25 | 11,660 133 | 8,280 115 | 4,420 32 | 3,860 83 |
| 2019-20 | 32,852 -171 | 24,485 -258 | 12,927 -156 | 11,558 -102 | 8,367 87 | 4,416 -4 | 3,951 91 |
| 2020-21 | 33,081 229 | 24,643 158 | 12,759 -168 | 11,884 326 | 8,438 71 | 4,314 -102 | 4,124 173 |
| 2021-22 | 34,464 1,383 | 25,826 1,183 | 13,389 630 | 12,437 553 | 8,638 200 | 4,312 -2 | 4,326 202 |
| 2022-23 | 34,734 270 | 26,355 529 | 13,605 216 | 12,750 313 | 8,379 -259 | 4,066 -246 | 4,313 -13 |
| Average | 32,762 | 24,683 | 13,247 | 11,436 | 8,080 | 4,311 | 3,769 |