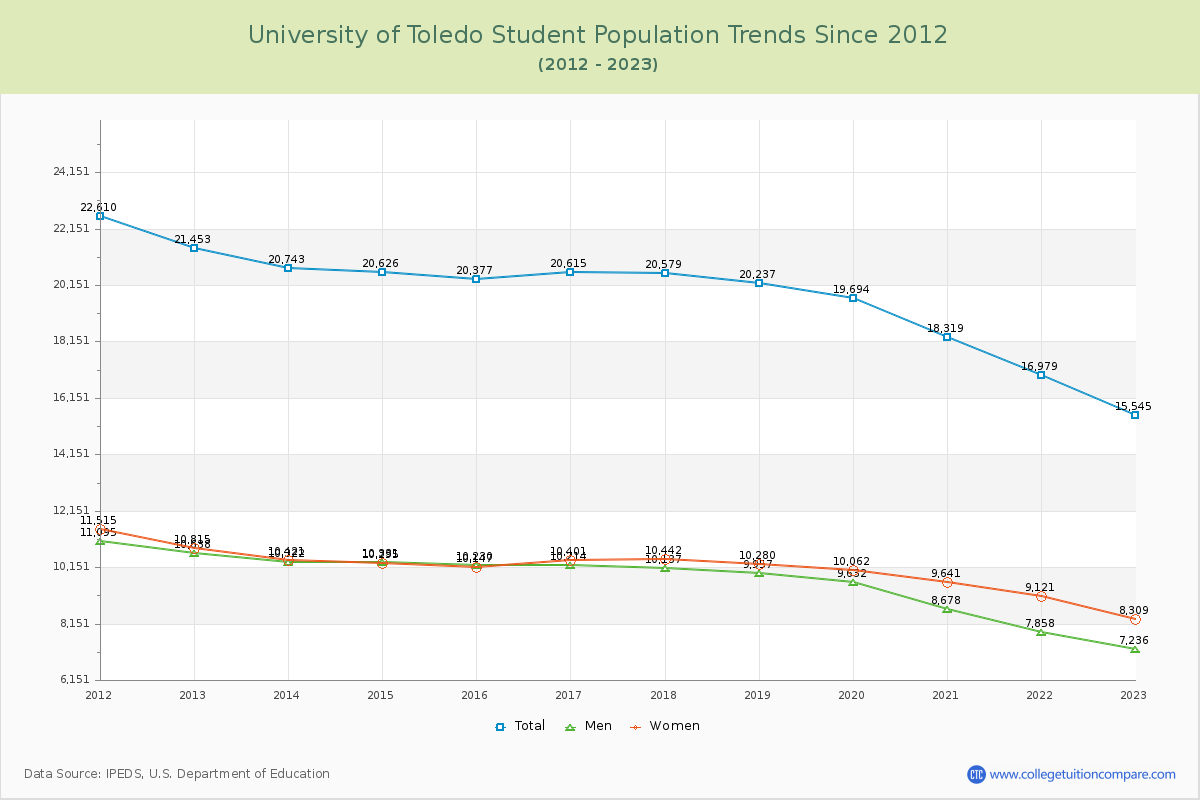
Student Population Changes
The average student population over the last 12 years is 19,561 where 15,545 students are attending the school for the academic year 2022-2023.
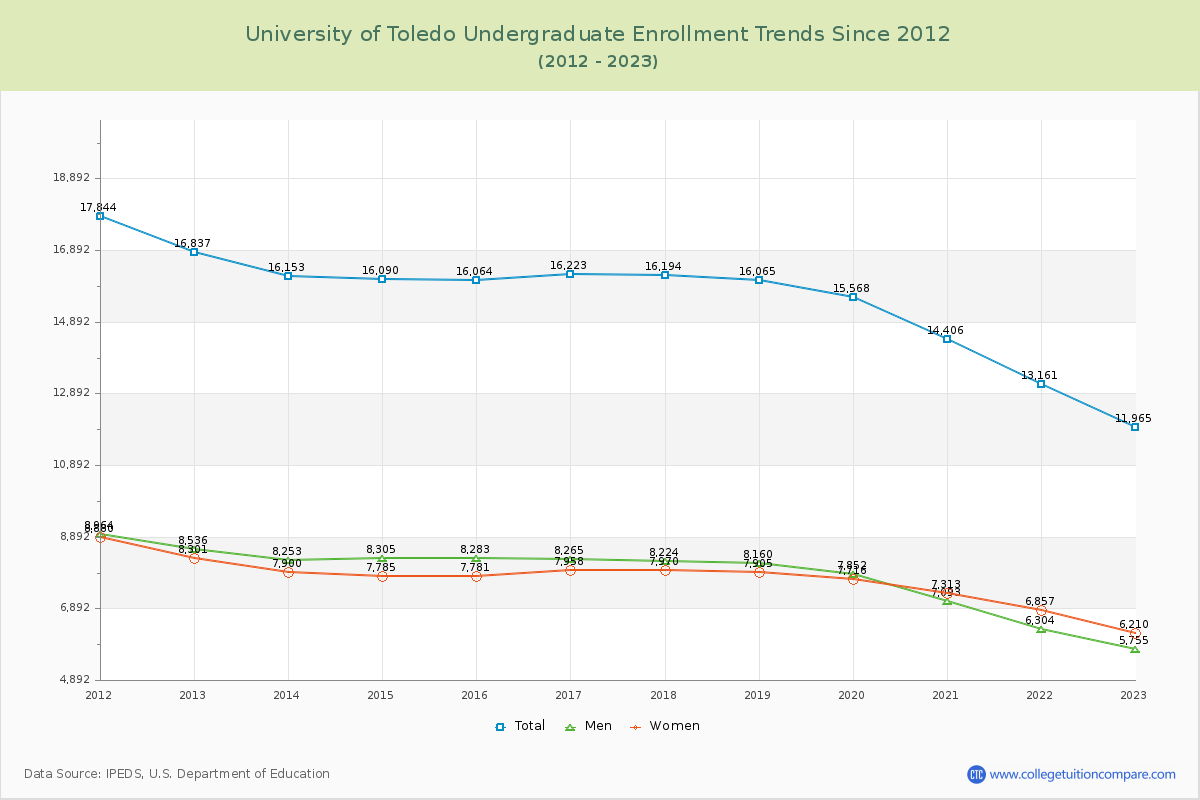
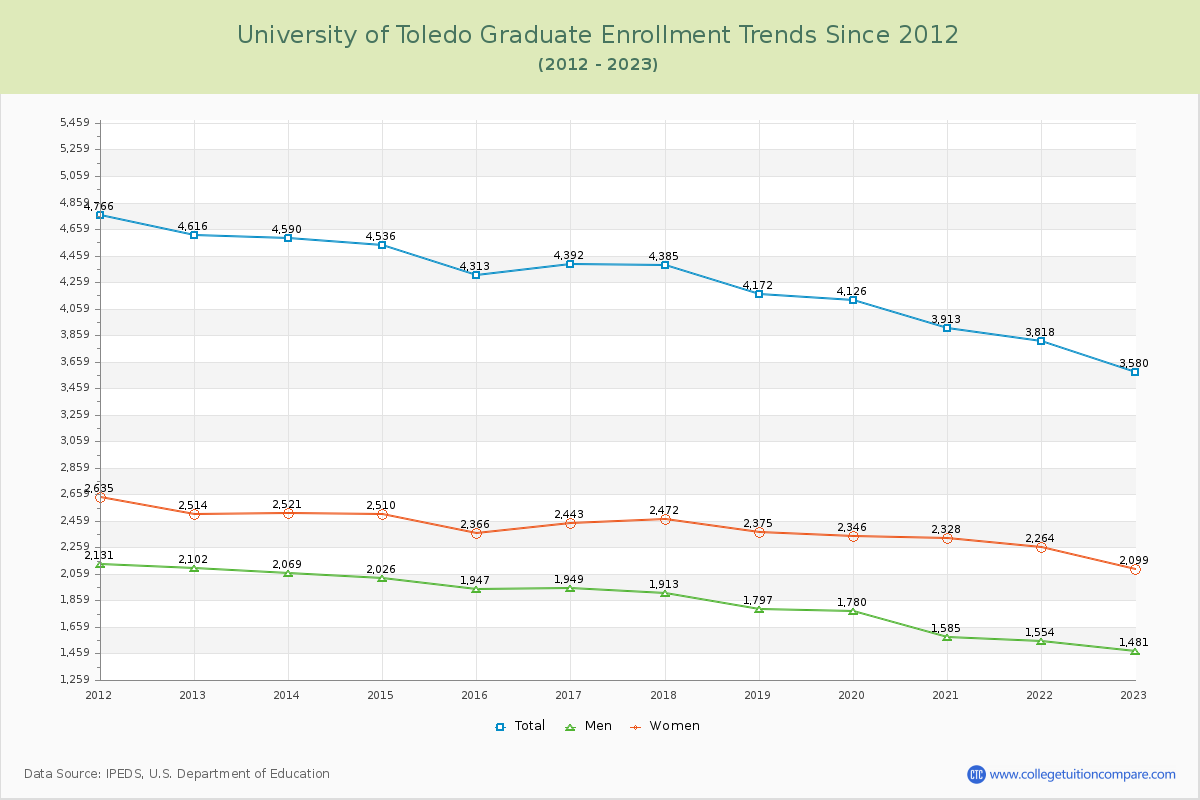
76.97% of total students is undergraduate students and 23.03% students is graduate students. The number of undergraduate students has decreased by 4,872 and the graduate enrollment has decreased by 1,036 over past 10 years.
The female to male ratio is 1.15 to 1 and it means that there are slightly more female students enrolled in U of Toledo than male students.
The following table and chart illustrate the changes in student population by gender at University of Toledo since 2012.
| Year | Total | Undergraduate | Graduate | ||||
|---|---|---|---|---|---|---|---|
| Total | Men | Women | Total | Men | Women | ||
| 2012-13 | 21,453 | 16,837 | 8,536 | 8,301 | 4,616 | 2,102 | 2,514 |
| 2013-14 | 20,743 -710 | 16,153 -684 | 8,253 -283 | 7,900 -401 | 4,590 -26 | 2,069 -33 | 2,521 7 |
| 2014-15 | 20,626 -117 | 16,090 -63 | 8,305 52 | 7,785 -115 | 4,536 -54 | 2,026 -43 | 2,510 -11 |
| 2015-16 | 20,377 -249 | 16,064 -26 | 8,283 -22 | 7,781 -4 | 4,313 -223 | 1,947 -79 | 2,366 -144 |
| 2016-17 | 20,615 238 | 16,223 159 | 8,265 -18 | 7,958 177 | 4,392 79 | 1,949 2 | 2,443 77 |
| 2017-18 | 20,579 -36 | 16,194 -29 | 8,224 -41 | 7,970 12 | 4,385 -7 | 1,913 -36 | 2,472 29 |
| 2018-19 | 20,237 -342 | 16,065 -129 | 8,160 -64 | 7,905 -65 | 4,172 -213 | 1,797 -116 | 2,375 -97 |
| 2019-20 | 19,694 -543 | 15,568 -497 | 7,852 -308 | 7,716 -189 | 4,126 -46 | 1,780 -17 | 2,346 -29 |
| 2020-21 | 18,319 -1,375 | 14,406 -1,162 | 7,093 -759 | 7,313 -403 | 3,913 -213 | 1,585 -195 | 2,328 -18 |
| 2021-22 | 16,979 -1,340 | 13,161 -1,245 | 6,304 -789 | 6,857 -456 | 3,818 -95 | 1,554 -31 | 2,264 -64 |
| 2022-23 | 15,545 -1,434 | 11,965 -1,196 | 5,755 -549 | 6,210 -647 | 3,580 -238 | 1,481 -73 | 2,099 -165 |
| Average | 19,561 | 15,339 | 7,730 | 7,609 | 4,222 | 1,837 | 2,385 |