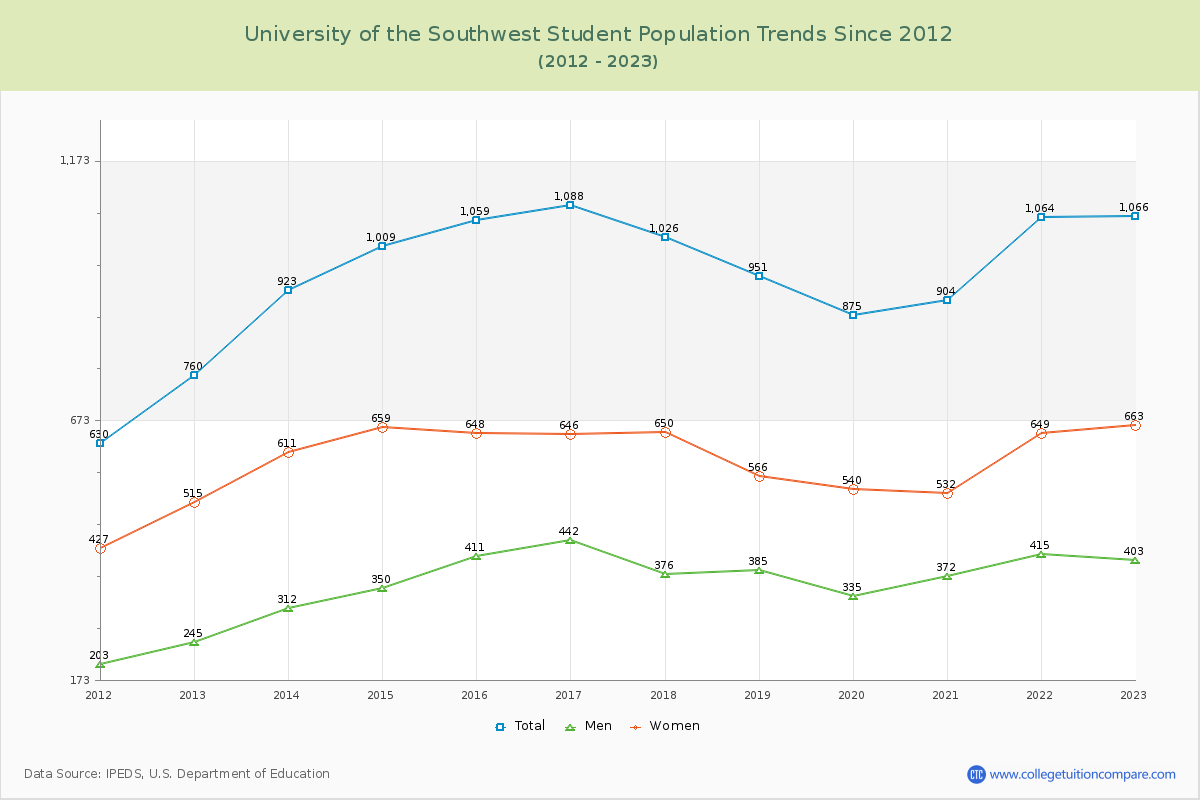
Student Population Changes
The average student population over the last 12 years is 975 where 1,066 students are attending the school for the academic year 2022-2023.
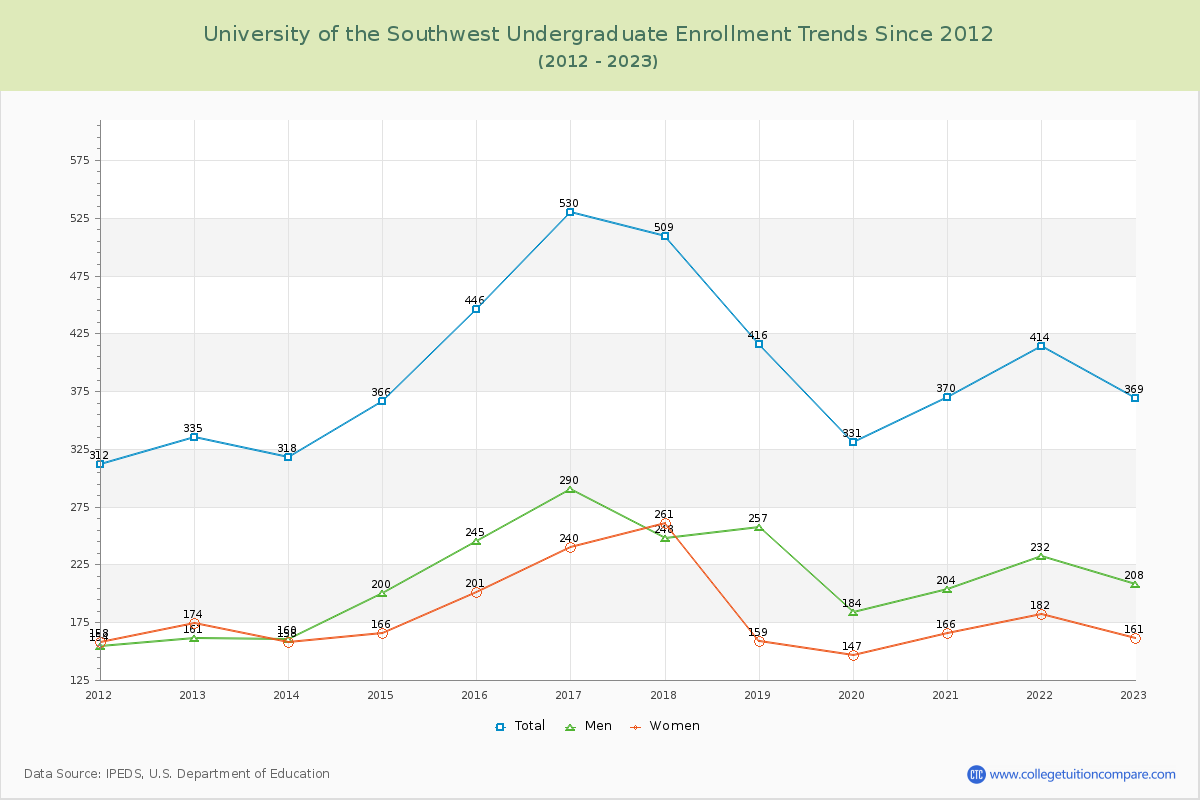
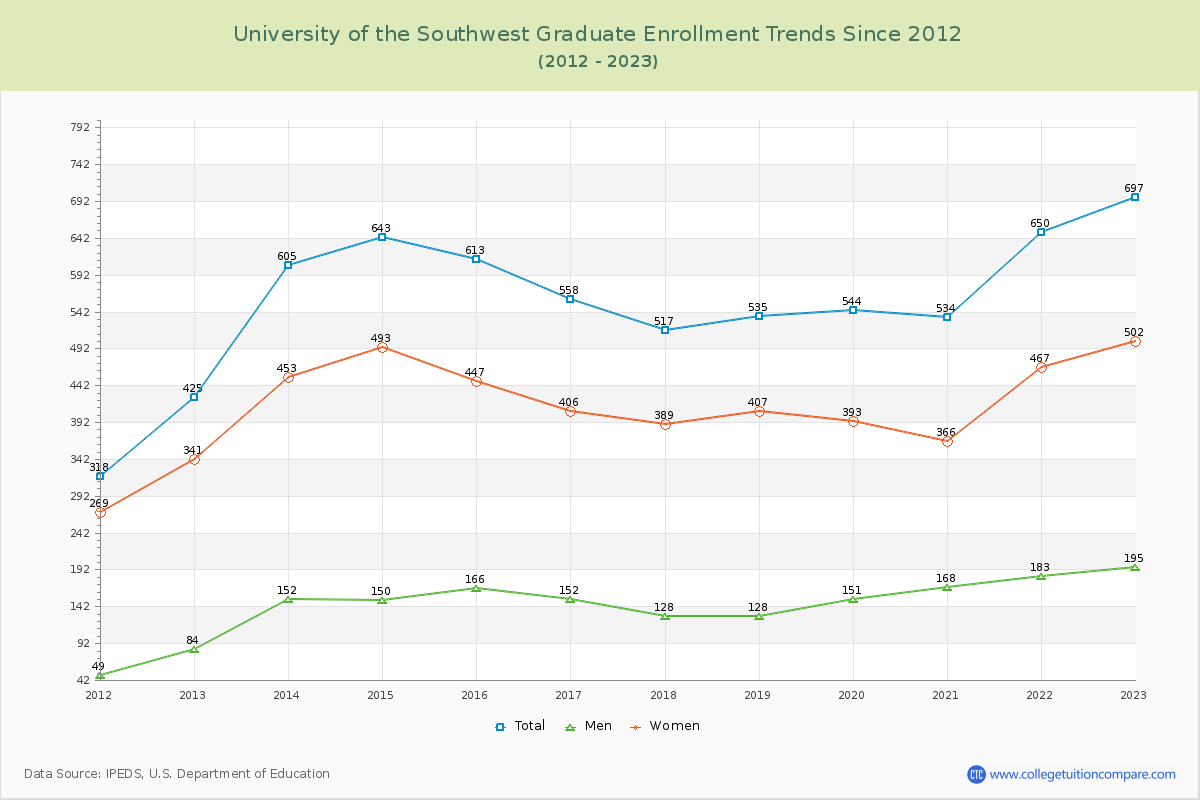
34.62% of total students is undergraduate students and 65.38% students is graduate students. The number of undergraduate students has increased by 34 and the graduate enrollment has increased by 272 over past 10 years.
The female to male ratio is 1.65 to 1 and it means that there are more female students enrolled in USW than male students.
The following table and chart illustrate the changes in student population by gender at University of the Southwest since 2012.
| Year | Total | Undergraduate | Graduate | ||||
|---|---|---|---|---|---|---|---|
| Total | Men | Women | Total | Men | Women | ||
| 2012-13 | 760 | 335 | 161 | 174 | 425 | 84 | 341 |
| 2013-14 | 923 163 | 318 -17 | 160 -1 | 158 -16 | 605 180 | 152 68 | 453 112 |
| 2014-15 | 1,009 86 | 366 48 | 200 40 | 166 8 | 643 38 | 150 -2 | 493 40 |
| 2015-16 | 1,059 50 | 446 80 | 245 45 | 201 35 | 613 -30 | 166 16 | 447 -46 |
| 2016-17 | 1,088 29 | 530 84 | 290 45 | 240 39 | 558 -55 | 152 -14 | 406 -41 |
| 2017-18 | 1,026 -62 | 509 -21 | 248 -42 | 261 21 | 517 -41 | 128 -24 | 389 -17 |
| 2018-19 | 951 -75 | 416 -93 | 257 9 | 159 -102 | 535 18 | 128 0 | 407 18 |
| 2019-20 | 875 -76 | 331 -85 | 184 -73 | 147 -12 | 544 9 | 151 23 | 393 -14 |
| 2020-21 | 904 29 | 370 39 | 204 20 | 166 19 | 534 -10 | 168 17 | 366 -27 |
| 2021-22 | 1,064 160 | 414 44 | 232 28 | 182 16 | 650 116 | 183 15 | 467 101 |
| 2022-23 | 1,066 2 | 369 -45 | 208 -24 | 161 -21 | 697 47 | 195 12 | 502 35 |
| Average | 975 | 400 | 217 | 183 | 575 | 151 | 424 |