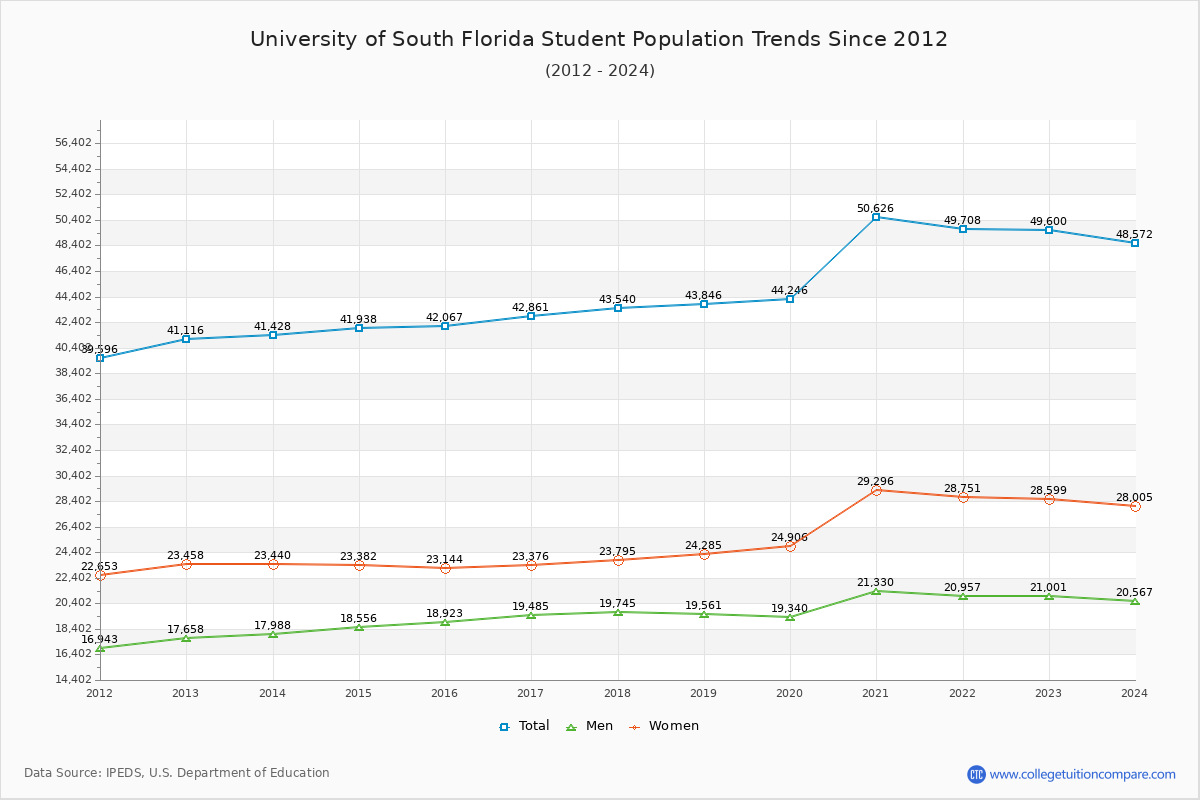
Student Population Changes
The average student population over the last 12 years is 44,634 where 49,600 students are attending the school for the academic year 2022-2023.
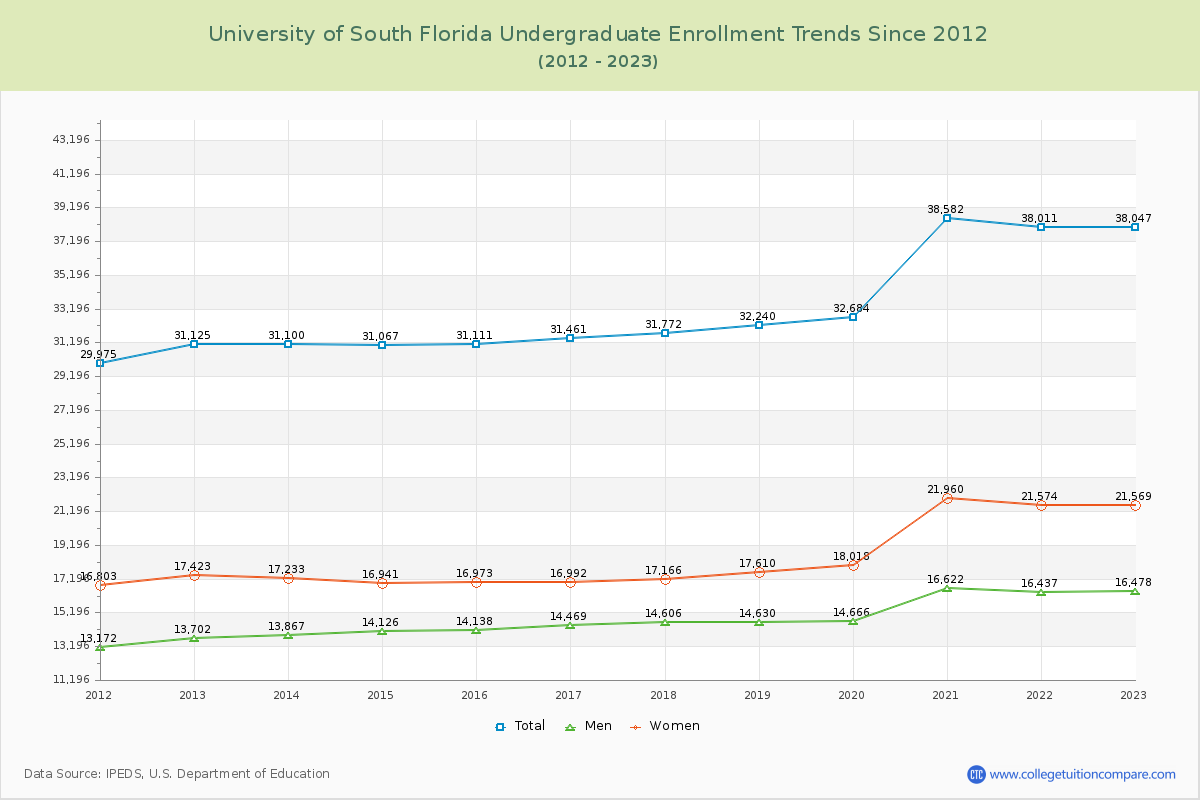
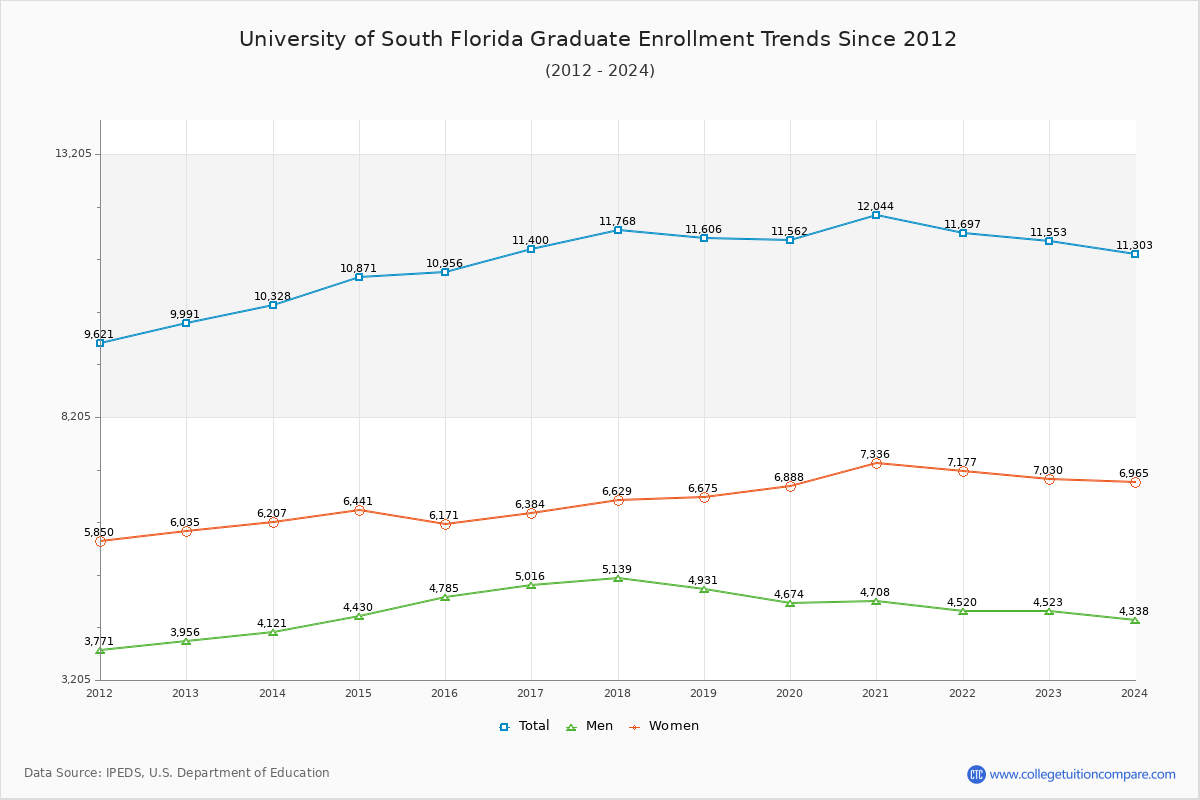
76.71% of total students is undergraduate students and 23.29% students is graduate students. The number of undergraduate students has increased by 6,922 and the graduate enrollment has increased by 1,562 over past 10 years.
The female to male ratio is 1.36 to 1 and it means that there are more female students enrolled in USF than male students.
The following table and chart illustrate the changes in student population by gender at University of South Florida since 2012.
| Year | Total | Undergraduate | Graduate | ||||
|---|---|---|---|---|---|---|---|
| Total | Men | Women | Total | Men | Women | ||
| 2012-13 | 41,116 | 31,125 | 13,702 | 17,423 | 9,991 | 3,956 | 6,035 |
| 2013-14 | 41,428 312 | 31,100 -25 | 13,867 165 | 17,233 -190 | 10,328 337 | 4,121 165 | 6,207 172 |
| 2014-15 | 41,938 510 | 31,067 -33 | 14,126 259 | 16,941 -292 | 10,871 543 | 4,430 309 | 6,441 234 |
| 2015-16 | 42,067 129 | 31,111 44 | 14,138 12 | 16,973 32 | 10,956 85 | 4,785 355 | 6,171 -270 |
| 2016-17 | 42,861 794 | 31,461 350 | 14,469 331 | 16,992 19 | 11,400 444 | 5,016 231 | 6,384 213 |
| 2017-18 | 43,540 679 | 31,772 311 | 14,606 137 | 17,166 174 | 11,768 368 | 5,139 123 | 6,629 245 |
| 2018-19 | 43,846 306 | 32,240 468 | 14,630 24 | 17,610 444 | 11,606 -162 | 4,931 -208 | 6,675 46 |
| 2019-20 | 44,246 400 | 32,684 444 | 14,666 36 | 18,018 408 | 11,562 -44 | 4,674 -257 | 6,888 213 |
| 2020-21 | 50,626 6,380 | 38,582 5,898 | 16,622 1,956 | 21,960 3,942 | 12,044 482 | 4,708 34 | 7,336 448 |
| 2021-22 | 49,708 -918 | 38,011 -571 | 16,437 -185 | 21,574 -386 | 11,697 -347 | 4,520 -188 | 7,177 -159 |
| 2022-23 | 49,600 -108 | 38,047 36 | 16,478 41 | 21,569 -5 | 11,553 -144 | 4,523 3 | 7,030 -147 |
| Average | 44,634 | 33,382 | 14,886 | 18,496 | 11,252 | 4,618 | 6,634 |