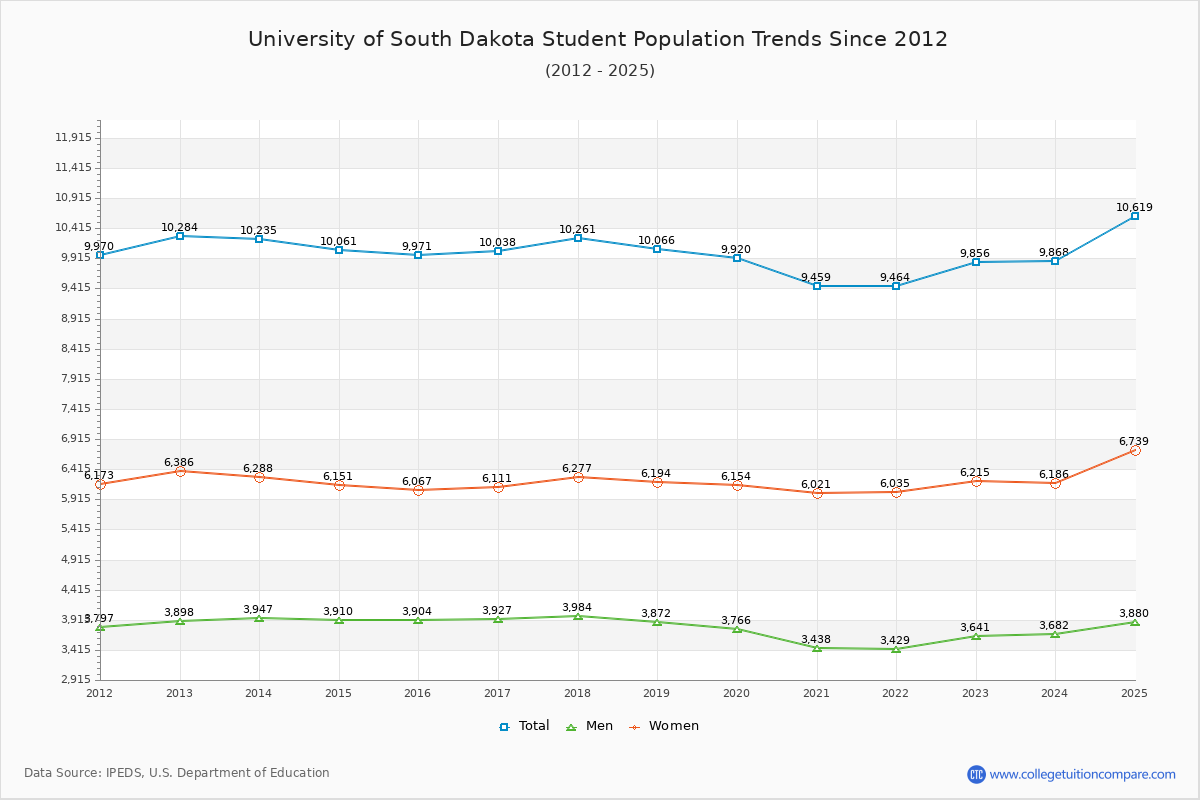
Student Population Changes
The average student population over the last 12 years is 9,965 where 9,856 students are attending the school for the academic year 2022-2023.
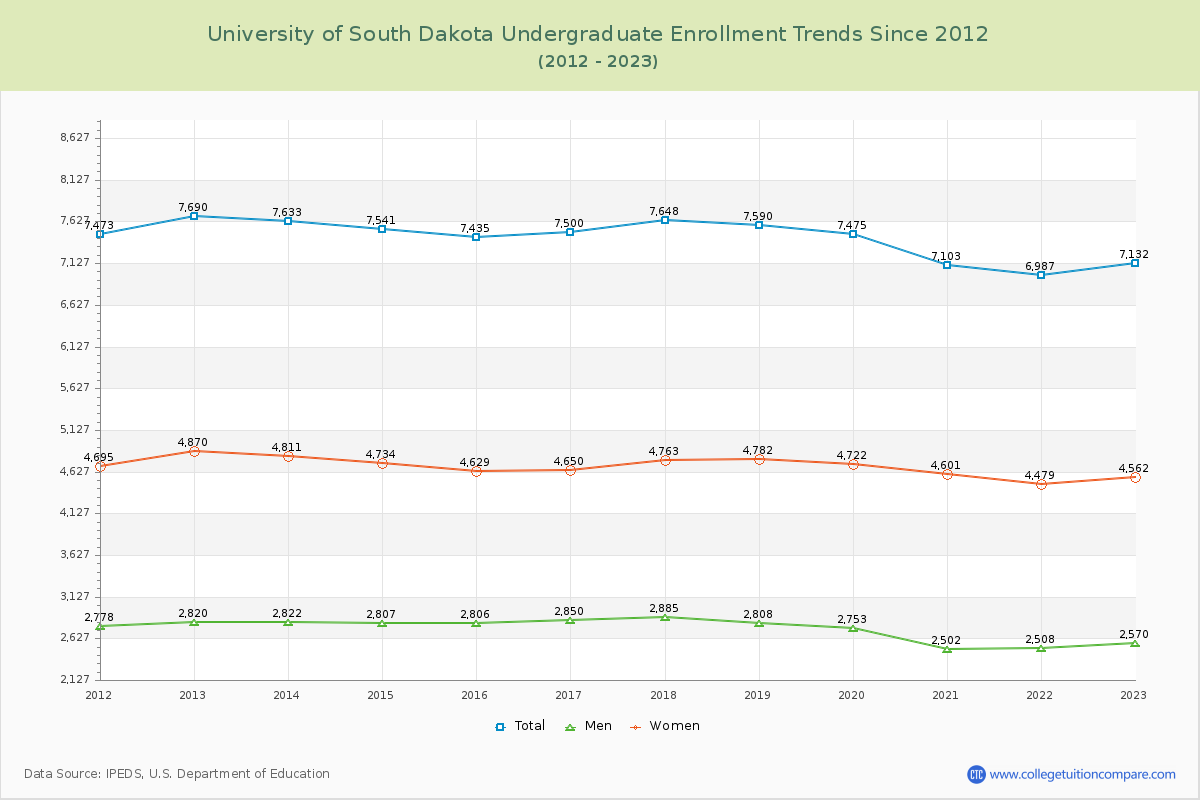
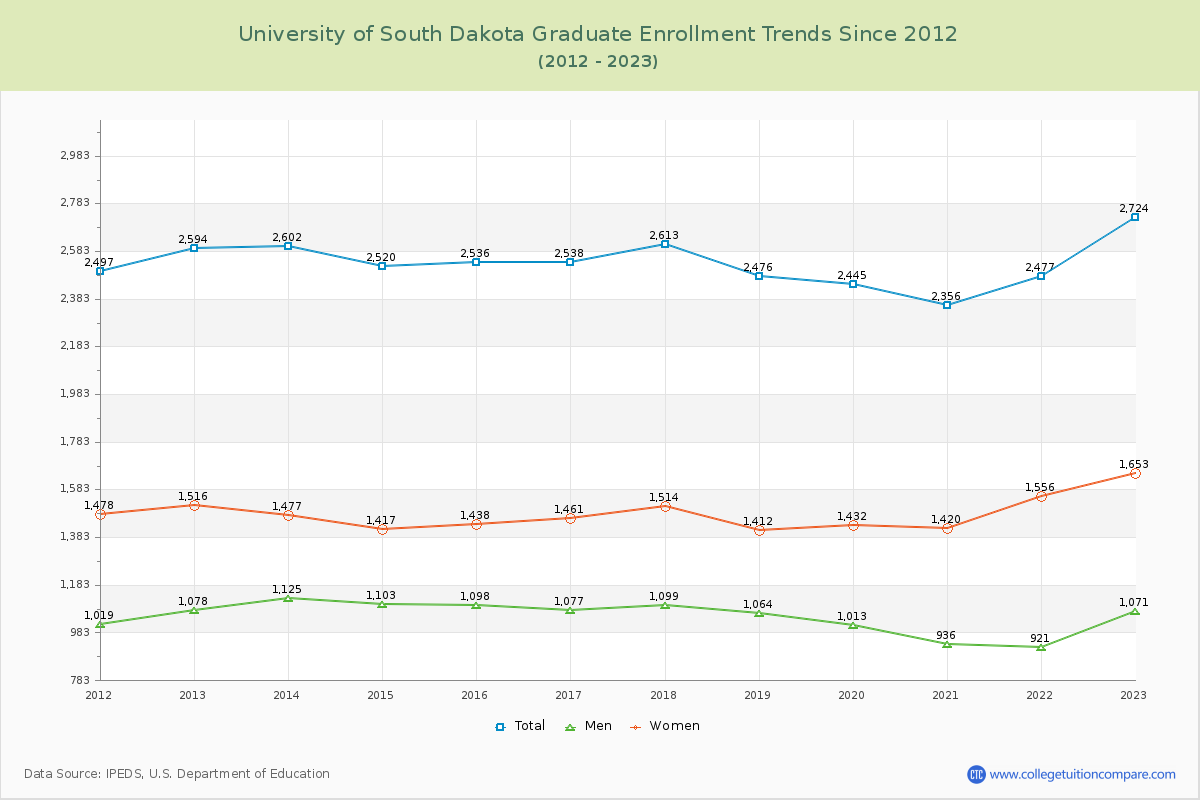
72.36% of total students is undergraduate students and 27.64% students is graduate students. The number of undergraduate students has decreased by 558 and the graduate enrollment has increased by 130 over past 10 years.
The female to male ratio is 1.71 to 1 and it means that there are more female students enrolled in USD than male students.
The following table and chart illustrate the changes in student population by gender at University of South Dakota since 2012.
| Year | Total | Undergraduate | Graduate | ||||
|---|---|---|---|---|---|---|---|
| Total | Men | Women | Total | Men | Women | ||
| 2012-13 | 10,284 | 7,690 | 2,820 | 4,870 | 2,594 | 1,078 | 1,516 |
| 2013-14 | 10,235 -49 | 7,633 -57 | 2,822 2 | 4,811 -59 | 2,602 8 | 1,125 47 | 1,477 -39 |
| 2014-15 | 10,061 -174 | 7,541 -92 | 2,807 -15 | 4,734 -77 | 2,520 -82 | 1,103 -22 | 1,417 -60 |
| 2015-16 | 9,971 -90 | 7,435 -106 | 2,806 -1 | 4,629 -105 | 2,536 16 | 1,098 -5 | 1,438 21 |
| 2016-17 | 10,038 67 | 7,500 65 | 2,850 44 | 4,650 21 | 2,538 2 | 1,077 -21 | 1,461 23 |
| 2017-18 | 10,261 223 | 7,648 148 | 2,885 35 | 4,763 113 | 2,613 75 | 1,099 22 | 1,514 53 |
| 2018-19 | 10,066 -195 | 7,590 -58 | 2,808 -77 | 4,782 19 | 2,476 -137 | 1,064 -35 | 1,412 -102 |
| 2019-20 | 9,920 -146 | 7,475 -115 | 2,753 -55 | 4,722 -60 | 2,445 -31 | 1,013 -51 | 1,432 20 |
| 2020-21 | 9,459 -461 | 7,103 -372 | 2,502 -251 | 4,601 -121 | 2,356 -89 | 936 -77 | 1,420 -12 |
| 2021-22 | 9,464 5 | 6,987 -116 | 2,508 6 | 4,479 -122 | 2,477 121 | 921 -15 | 1,556 136 |
| 2022-23 | 9,856 392 | 7,132 145 | 2,570 62 | 4,562 83 | 2,724 247 | 1,071 150 | 1,653 97 |
| Average | 9,965 | 7,430 | 2,739 | 4,691 | 2,535 | 1,053 | 1,481 |