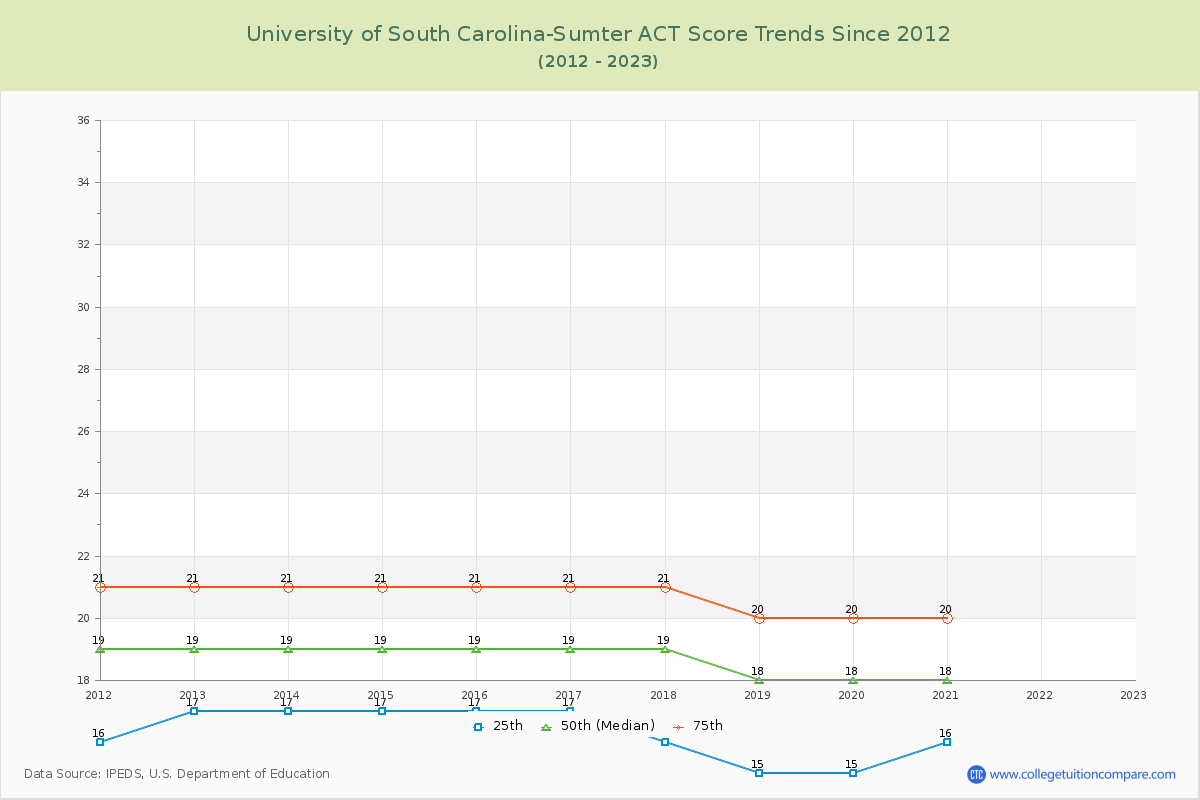
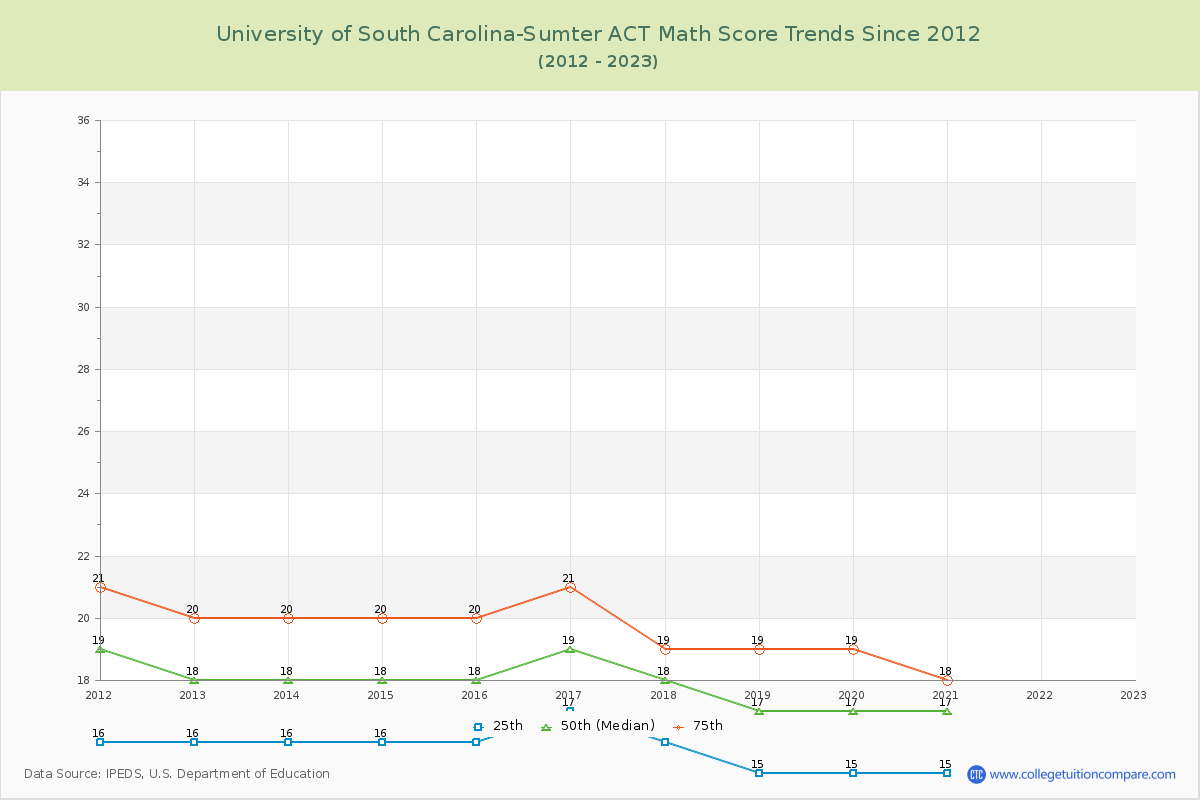
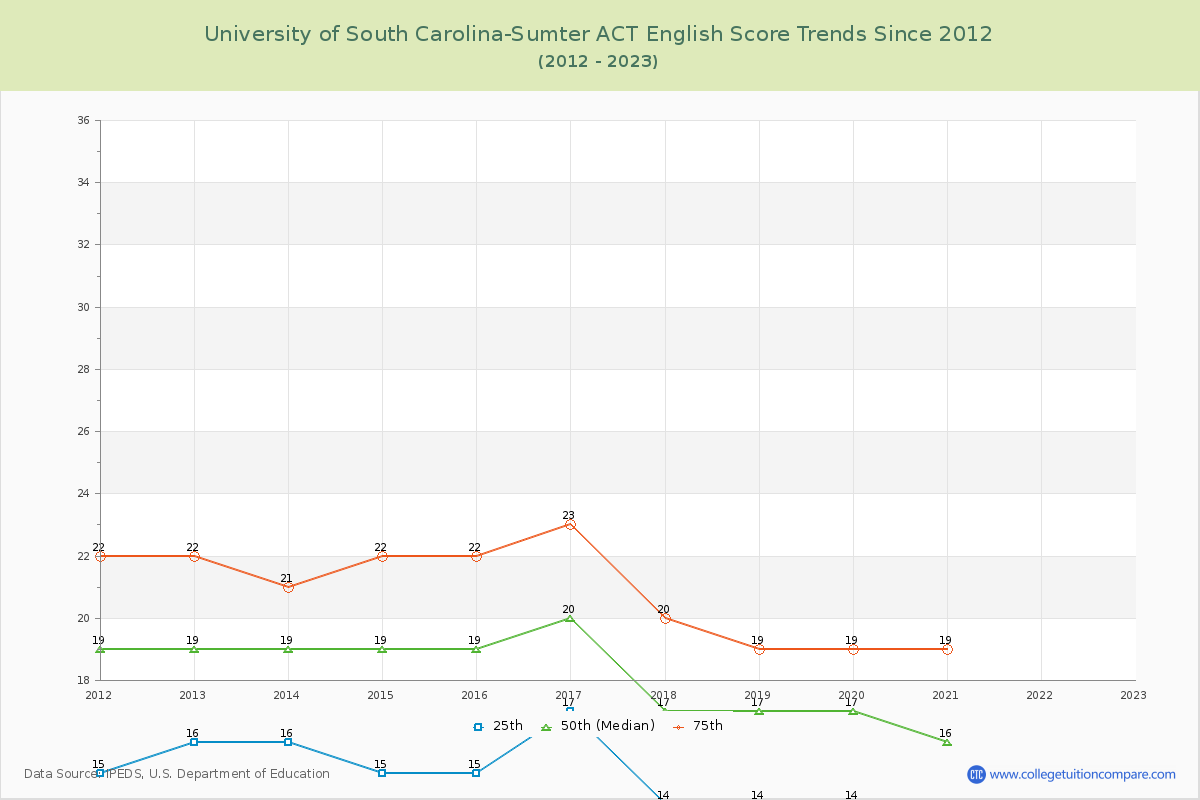
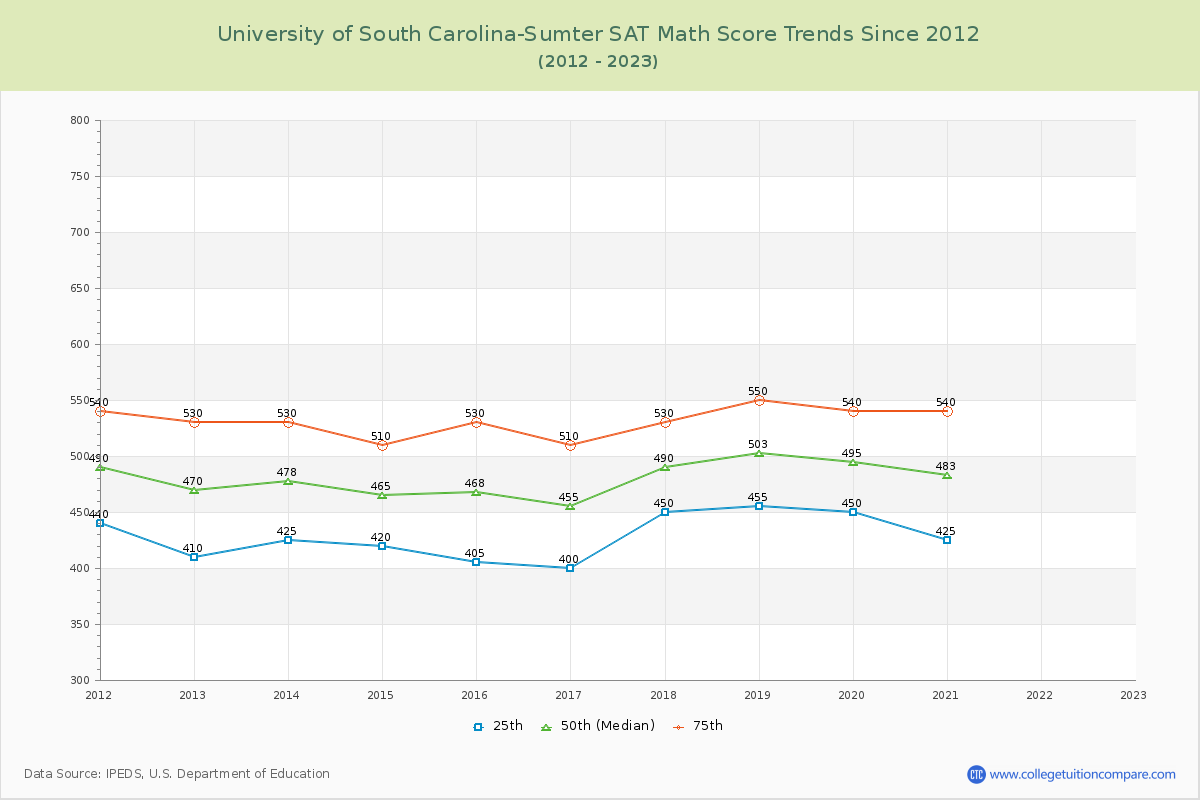
SAT Scores Over Time
The 2023 SAT score is at U of South Carolina-Sumter. Over the past 12 years, the average SAT score is 864 (25th percentile) and 1079 (75th percentile). Compared to similar schools, the submitted SAT scores are around national average at U of South Carolina-Sumter.
The following table and chart illustrate the changes in SAT scores at University of South Carolina-Sumter since 2012.
| Year | Total | Math | Evidence-Based Reading and Writing | ||||||
|---|---|---|---|---|---|---|---|---|---|
| 25th | 50th | 75th | 25th | 50th | 75th | 25th | 50th | 75th | |
| 2012-13 | 830 | 945 | 1,060 | 410 | 470 | 530 | 420 | 475 | 530 |
| 2013-14 | 835 | 953 | 1,070 | 425 | 478 | 530 | 410 | 475 | 540 |
| 2014-15 | 820 | 925 | 1,030 | 420 | 465 | 510 | 400 | 460 | 520 |
| 2015-16 | 825 | 943 | 1,060 | 405 | 468 | 530 | 420 | 475 | 530 |
| 2016-17 | 815 | 925 | 1,035 | 400 | 455 | 510 | 415 | 470 | 525 |
| 2017-18 | 910 | 1,005 | 1,100 | 450 | 490 | 530 | 460 | 515 | 570 |
| 2018-19 | 925 | 1,028 | 1,130 | 455 | 503 | 550 | 470 | 525 | 580 |
| 2019-20 | 920 | 1,015 | 1,110 | 450 | 495 | 540 | 470 | 520 | 570 |
| 2020-21 | 895 | 1,008 | 1,120 | 425 | 483 | 540 | 470 | 525 | 580 |
| 2021-22 | - | - | - | - | - | - | - | - | - |
| 2022-23 | - | - | - | - | - | - | - | - | - |
| Average | 864 | 972 | 1079 | 427 | 478 | 530 | 437 | 493 | 549 |
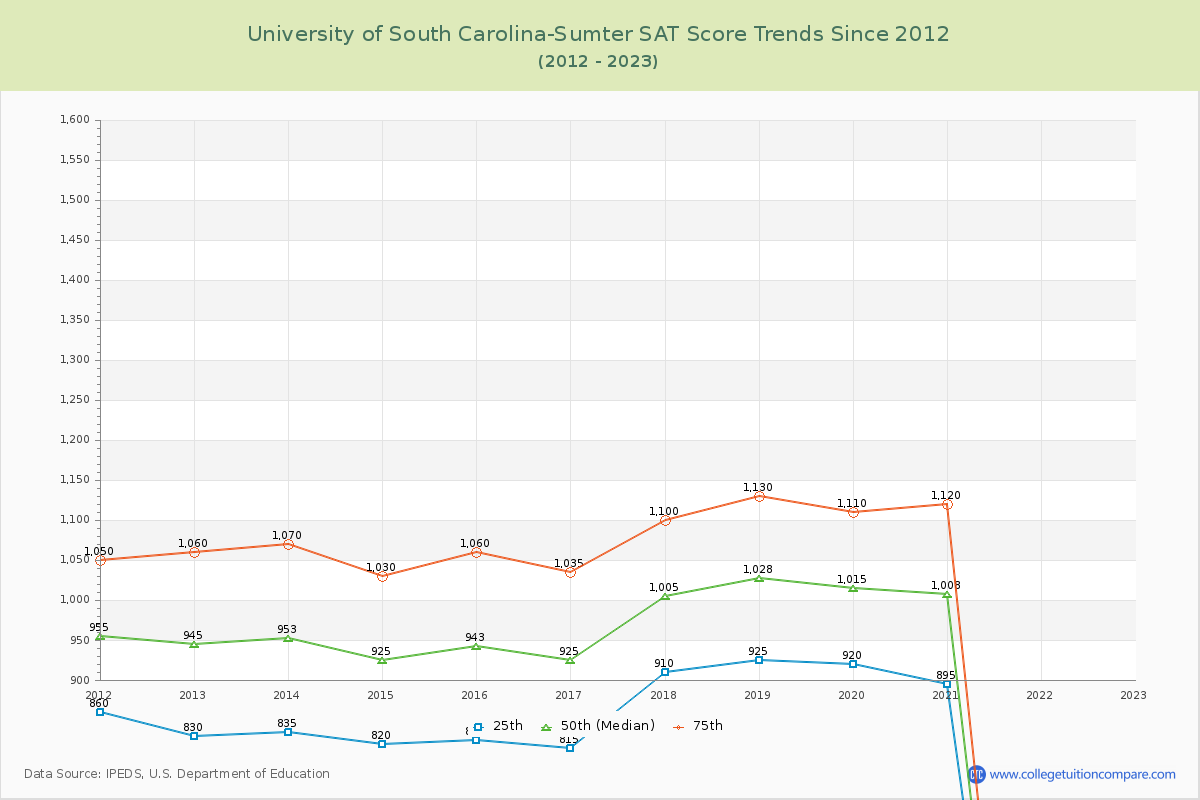
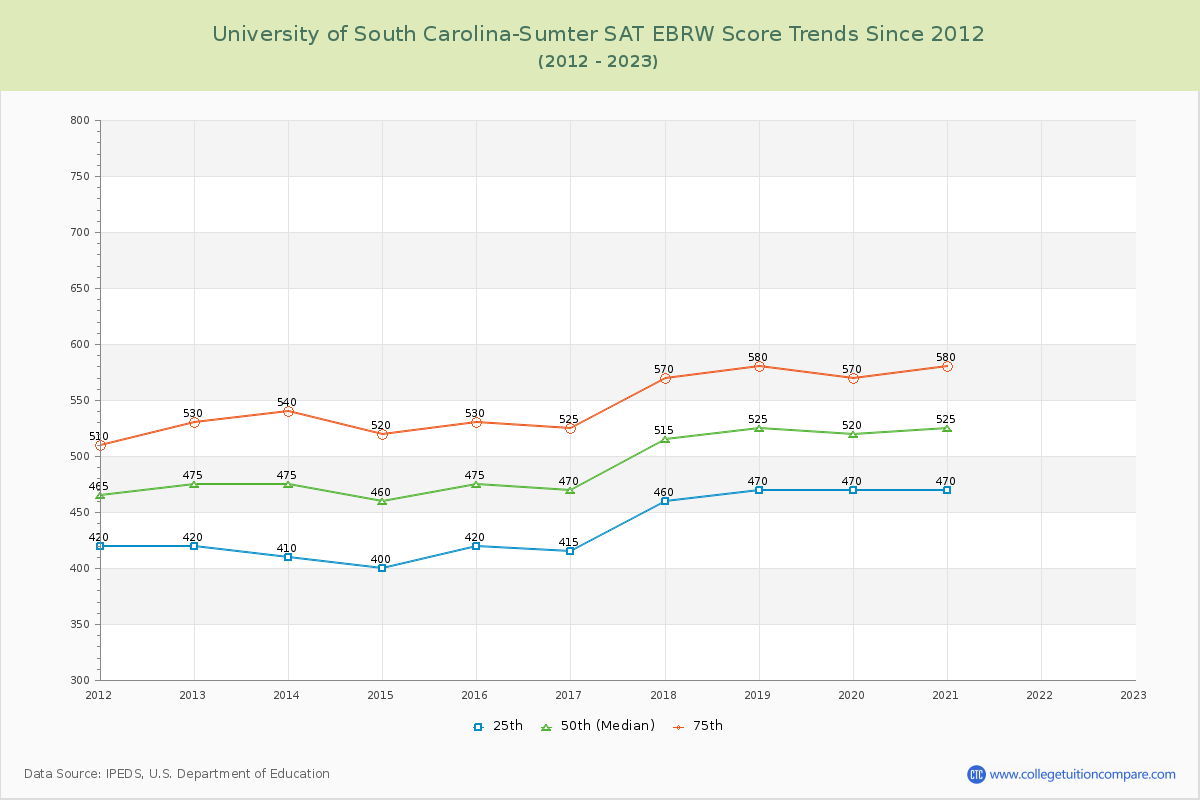
*SAT Evidence-Based Reading and Writing replaces SAT critical reading and writing since year 2017.
**The SAT Writing score is excluded from the total scores for year from 2011 to 2016.