SAT Scores Over Time
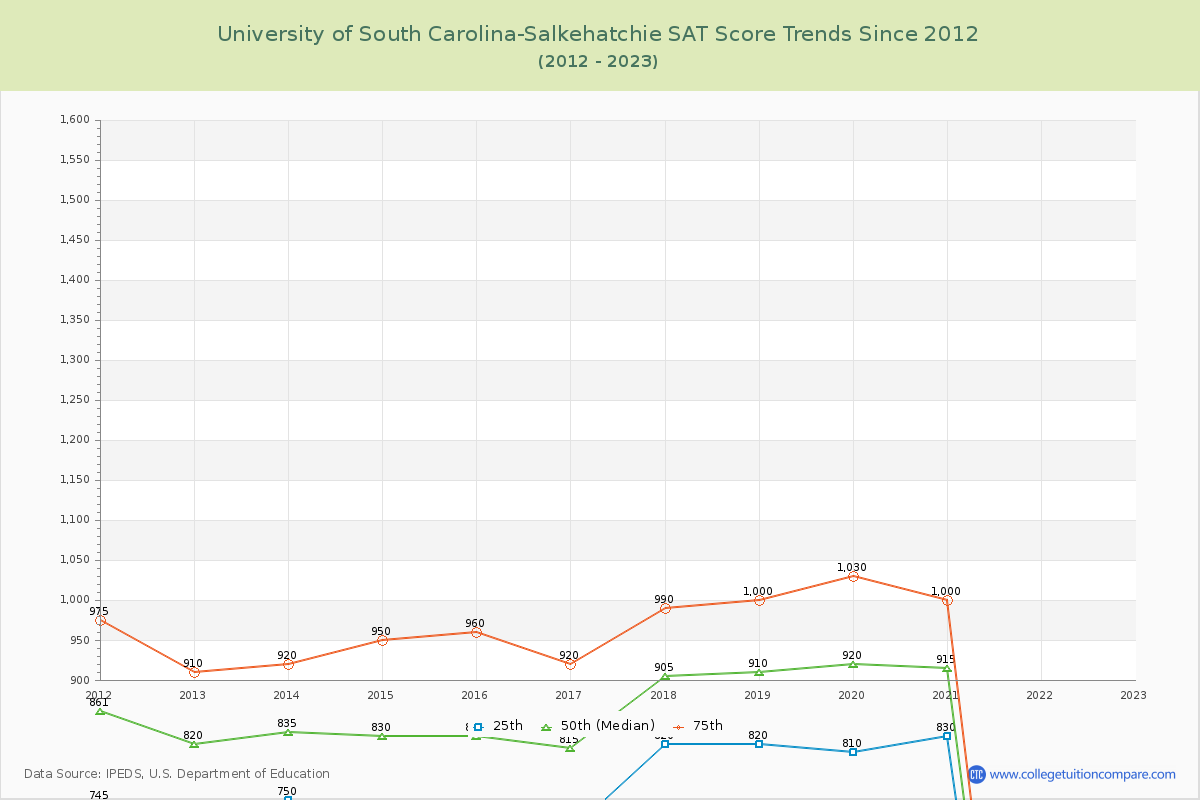
The 2023 SAT score is at U of South Carolina-Salkehatchie. Over the past 12 years, the average SAT score is 764 (25th percentile) and 964 (75th percentile). Compared to similar schools, the submitted SAT scores are around national average at U of South Carolina-Salkehatchie.
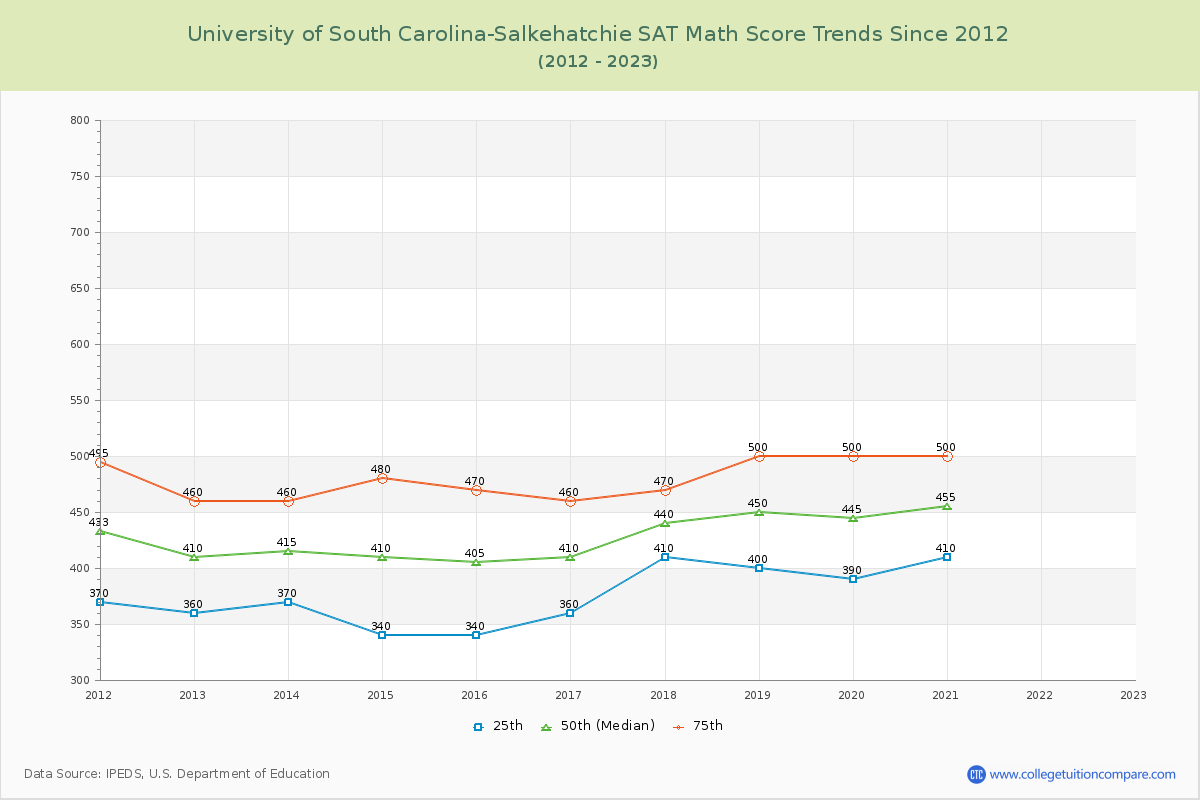
The following table and chart illustrate the changes in SAT scores at University of South Carolina-Salkehatchie since 2012.
| Year | Total | Math | Evidence-Based Reading and Writing | ||||||
|---|---|---|---|---|---|---|---|---|---|
| 25th | 50th | 75th | 25th | 50th | 75th | 25th | 50th | 75th | |
| 2012-13 | 730 | 820 | 910 | 360 | 410 | 460 | 370 | 410 | 450 |
| 2013-14 | 750 | 835 | 920 | 370 | 415 | 460 | 380 | 420 | 460 |
| 2014-15 | 710 | 830 | 950 | 340 | 410 | 480 | 370 | 420 | 470 |
| 2015-16 | 700 | 830 | 960 | 340 | 405 | 470 | 360 | 425 | 490 |
| 2016-17 | 710 | 815 | 920 | 360 | 410 | 460 | 350 | 405 | 460 |
| 2017-18 | 820 | 905 | 990 | 410 | 440 | 470 | 410 | 465 | 520 |
| 2018-19 | 820 | 910 | 1,000 | 400 | 450 | 500 | 420 | 460 | 500 |
| 2019-20 | 810 | 920 | 1,030 | 390 | 445 | 500 | 420 | 475 | 530 |
| 2020-21 | 830 | 915 | 1,000 | 410 | 455 | 500 | 420 | 460 | 500 |
| 2021-22 | - | - | - | - | - | - | - | - | - |
| 2022-23 | - | - | - | - | - | - | - | - | - |
| Average | 764 | 864 | 964 | 376 | 427 | 478 | 389 | 438 | 487 |
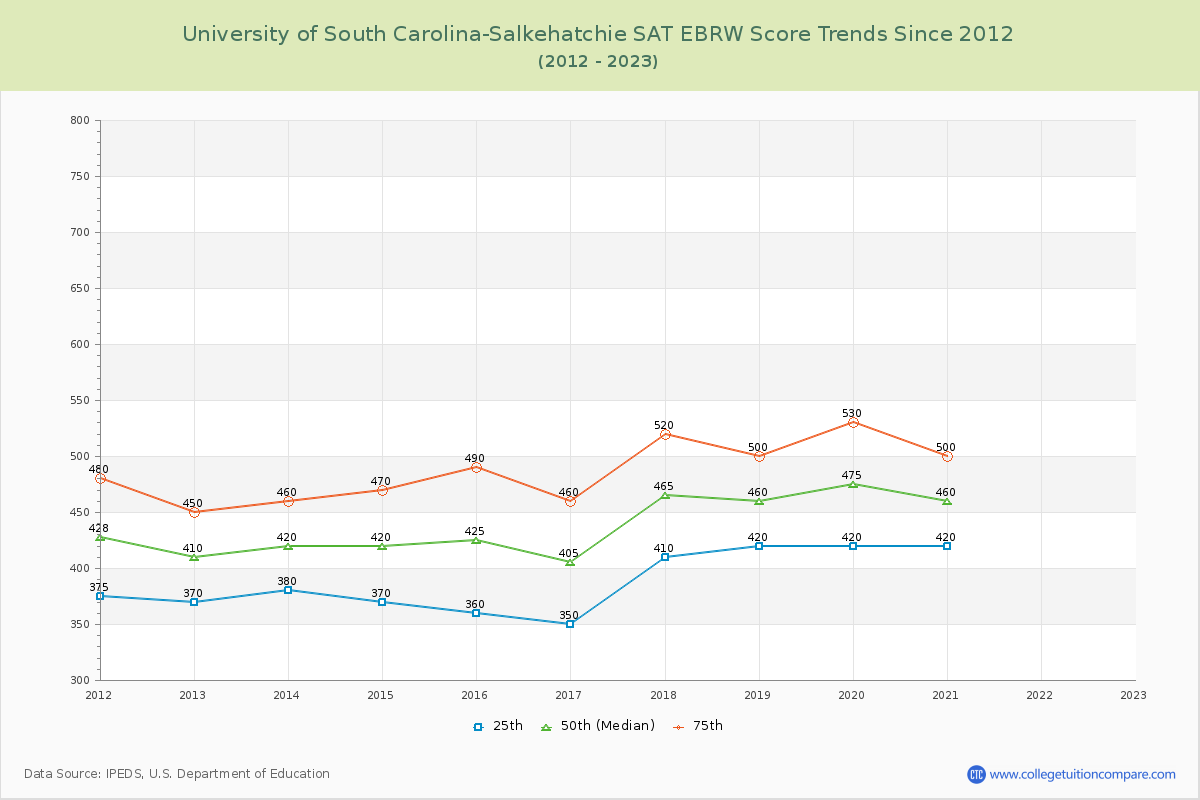
*SAT Evidence-Based Reading and Writing replaces SAT critical reading and writing since year 2017.
**The SAT Writing score is excluded from the total scores for year from 2011 to 2016.