Enrollment Trends at USCB

228

Total Enrollment

33

Men

195

Women

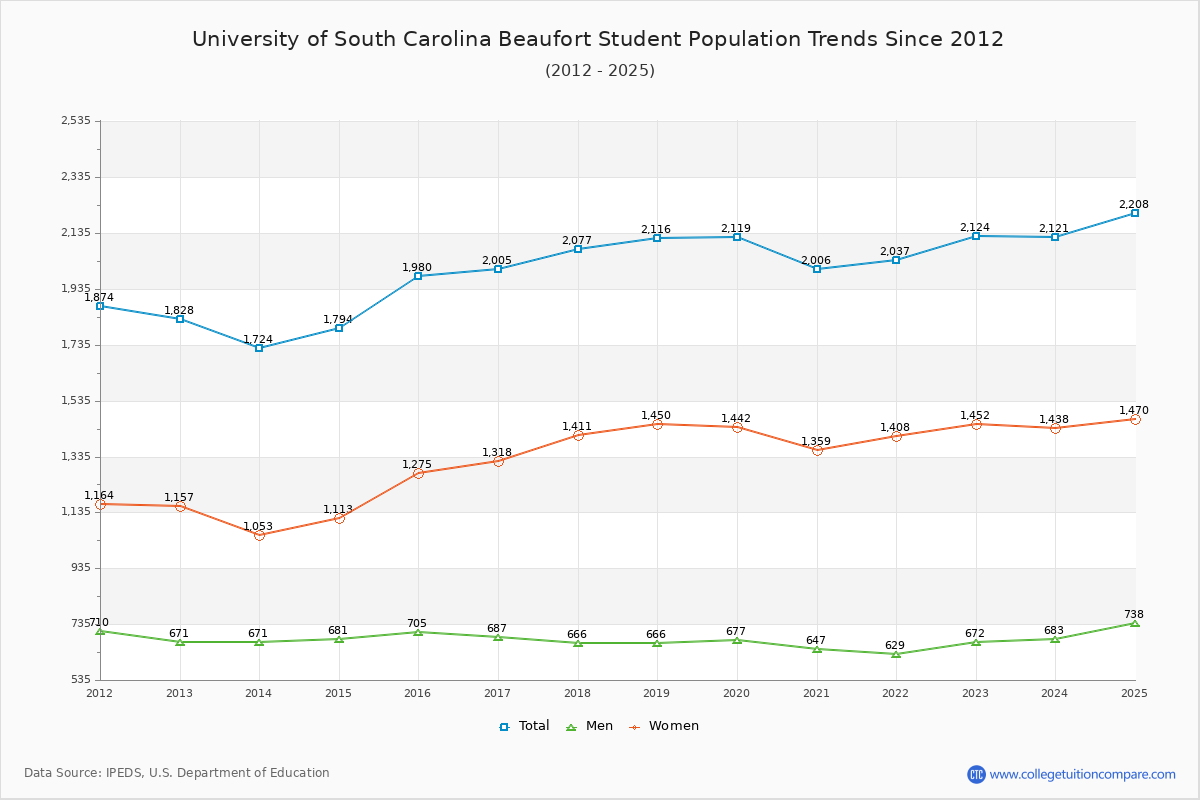
The student population at University of South Carolina Beaufort is 2,208 (2,162 undergraduate and 46 graduate students) . The number of students has increased by 228 over the past decade.

The percentage of undergraduate students at USCB is 97.92% which is increased by 182 over last 10 years. The graduate student population increased by 46 and it has been increasing.

The female to male ratio is 1.99 to 1 which means that female students enrolled more than male students.

397 students enrolled in online degree program exclusively and the number of online students has increased by 326.88% since 2015.

Student Population Changes

The average student population over the last 11 years is 2,079 where 2,208 students are attending the school for the academic year 2024-2025.

97.92% of total students is undergraduate students and 2.08% students is graduate students. The number of undergraduate students has increased by 182 and the graduate enrollment has increased by 46 over past 10 years.

The female to male ratio is 1.99 to 1 and it means that there are more female students enrolled in USCB than male students.

The following table and chart illustrate the changes in student population by gender at University of South Carolina Beaufort since 2015.

YearTotalUndergraduateGraduate
TotalMenWomenTotalMenWomen
2015-161,9801,9807051,275000
2016-172,005
25
2,005
25
687
-18
1,318
43
000
2017-182,077
72
2,077
72
666
-21
1,411
93
000
2018-192,116
39
2,116
39
6661,450
39
000
2019-202,119
3
2,112
-4
674
8
1,438
-12
7
7
3
3
4
4
2020-212,006
-113
1,999
-113
642
-32
1,357
-81
75
2
2
-2
2021-222,037
31
2,023
24
626
-16
1,397
40
14
7
3
-2
11
9
2022-232,124
87
2,053
30
661
35
1,392
-5
71
57
11
8
60
49
2023-242,121
-3
2,067
14
675
14
1,39254
-17
8
-3
46
-14
2024-252,208
87
2,162
95
728
53
1,434
42
46
-8
10
2
36
-10
Average2,0792,0596731,38620416
University of South Carolina Beaufort Enrollment Trends Chart

Undergraduate Enrollment Changes

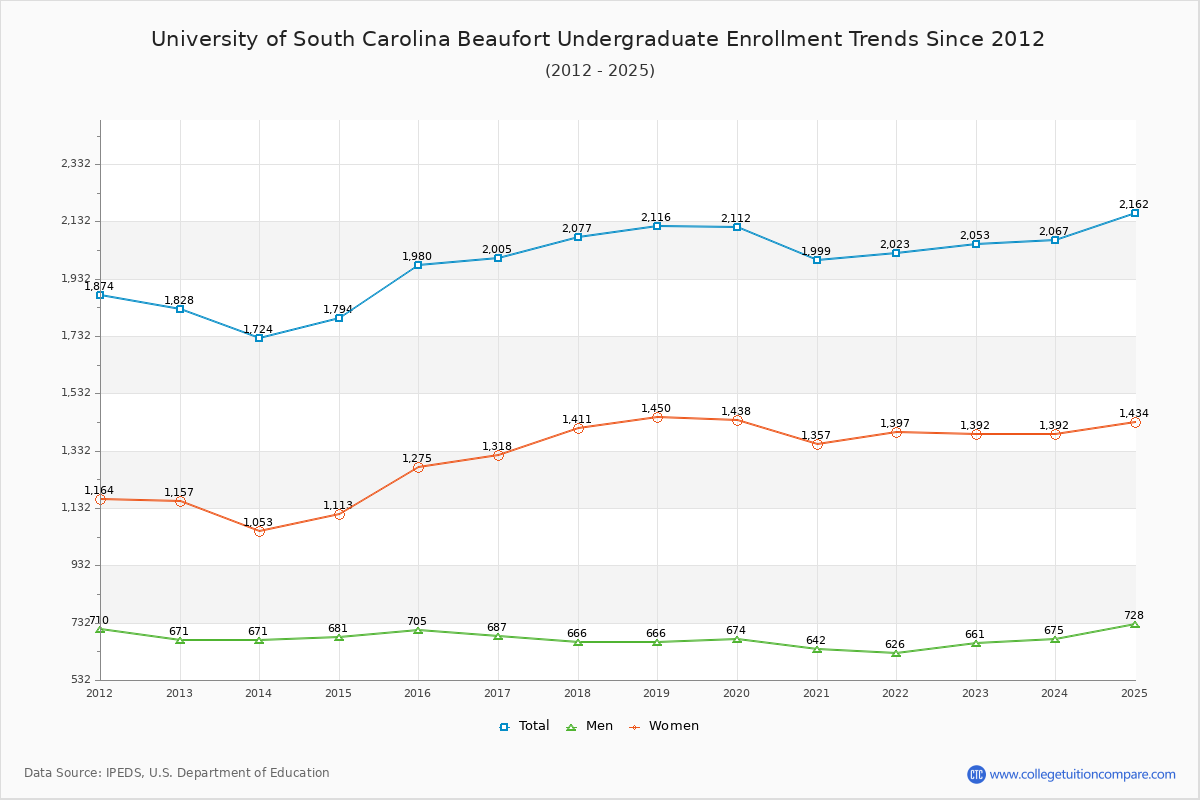
The average number of Undergraduate students over the last 11 years is 2,059 where 2,162 students are attending the Undergraduate school for the academic year 2024-2025. The following table and chart illustrate the changes in Undergraduate enrollment by attending status and gender at University of South Carolina Beaufort since 2015.

YearTotalFull-timePart-time
TotalMenWomenTotalMenWomen
2015-161,9801,6565791,077324126198
2016-172,0051,7466021,14425985174
2017-182,0771,7975861,21128080200
2018-192,1161,7975711,22631995224
2019-202,1121,7755641,211337110227
2020-211,9991,6705171,153329125204
2021-222,0231,6054941,111418132286
2022-232,0531,6655321,133388129259
2023-242,0671,7205651,155347110237
2024-252,1621,8526161,236310112198
Average2,0592,0595631,1662,059110221
University of South Carolina Beaufort Undergraduate Enrollment Trends Chart

Graduate Enrollment Changes

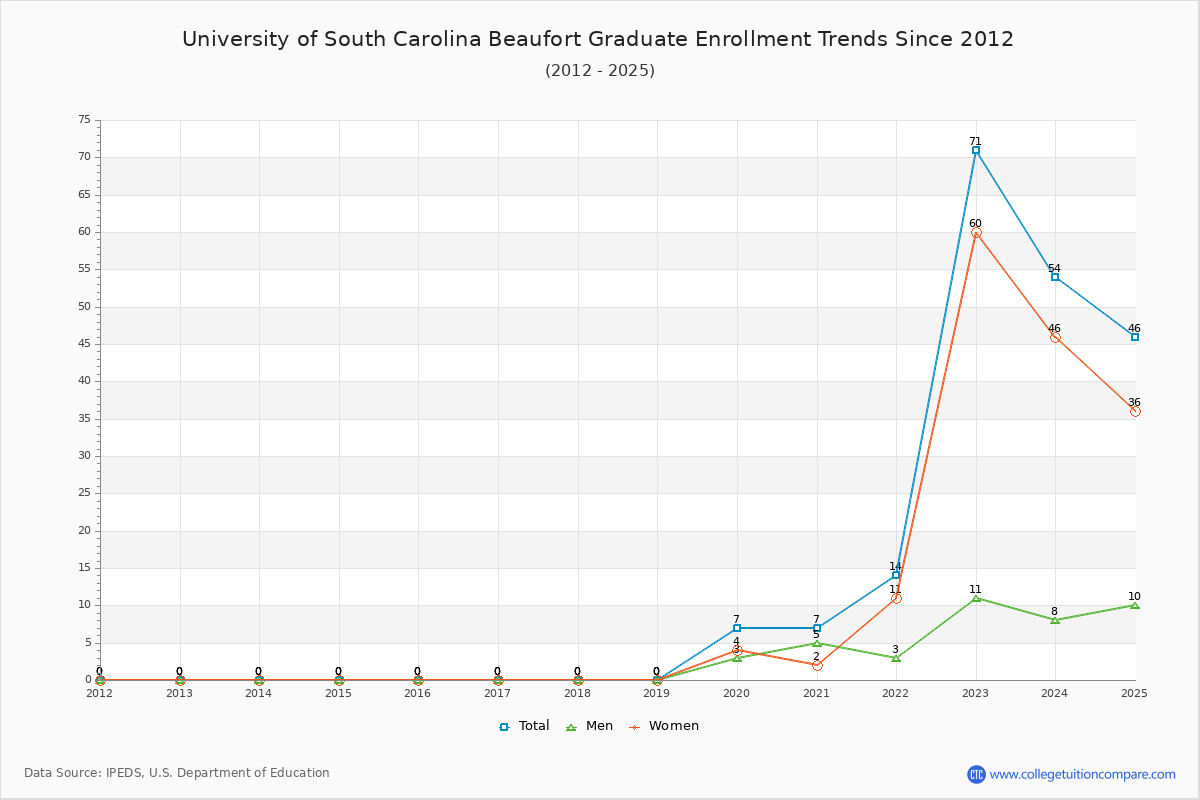
The average number of Graduate students over the last 11 years is 20 where 46 students are attending the Graduate school for the academic year 2024-2025. The following table and chart illustrate the changes in Graduate enrollment by attending status and gender at University of South Carolina Beaufort since 2015.

YearTotalFull-timePart-time
TotalMenWomenTotalMenWomen
2015-160000000
2016-170000000
2017-180000000
2018-190000000
2019-207330404
2020-217550202
2021-22144131028
2022-237184463756
2023-245463348543
2024-254665140535
Average20202120215
University of South Carolina Beaufort Graduate Enrollment Trends Chart

Enrollment by Race/Ethnicity Changes

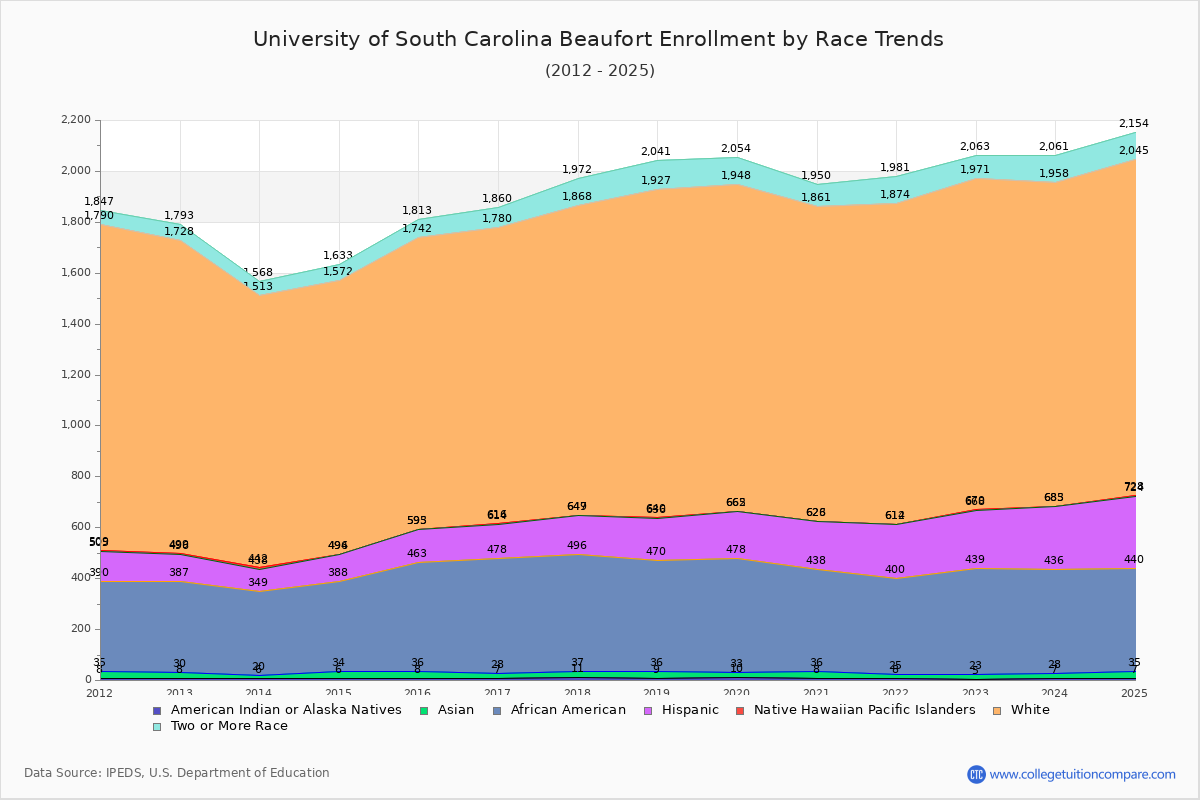
The percentage of white students is 59.65%. The percentage was 57.93% 10 years ago and USCB still has a high percentage of white students. 1.27% of enrolled students is Asian and 18.34% is black students. Hispanic students comprise 12.86% of the student body.

Over the past 10 years, the racial composition has shifted. The percentage of white students increased from 57.93% to 59.65%. Asian enrollment declined from 1.41% to 1.27%. Black student enrollment decreased from 21.57% to 18.34%. Hispanic student representation expanded from 6.57% to 12.86%.

The overall racial diversity, measured by the Census Bureau Diversity Index, is 0.5914 which indicates that moderately diverse. This decreased from 0.6121 a decade ago, suggesting that racial diversity has declined.

The following table and chart illustrate the student population trends by race/ethnicity at University of South Carolina Beaufort over the past 11 years (2015-2025).

YearAmerican Indian or Native AmericanAsianBlackHispanicNative Hawaiian or Other Pacific IslanderWhiteTwo or More Races
2015-1682842713021,14771
2016-1772145013621,16480
2017-18112645915121,219104
2018-1992743416641,287114
2019-20102344518431,283106
2020-2182840218531,23589
2021-2281737521221,260107
2022-2351841622921,30192
2023-2472140824721,273103
2024-2572840528441,317109
Average82442219231,24998
University of South Carolina Beaufort Enrollment by Race Trends Chart

Distance Learning (Online Courses) Enrollment Changes

397 students are enrolled in online degree programs exclusively for the academic year 2024-2025, which is 18% of total students. The number of online students has increased 326.88% since 2015. The following table and chart illustrate the changes in the online student population by enrolled type at University of South Carolina Beaufort from 2015 to 2025.

YearTotal EnrollmentOnline CompletelyEnrolled in Some Online CoursesNot Enrolled in Online Courses
2015-161,980936121,275
2016-172,005165521,437
2017-182,0771677711,139
2018-192,1161878451,084
2019-202,1191858051,129
2020-212,0064451,459102
2021-222,0373091,215513
2022-232,1243691,231524
2023-242,1213861,191544
2024-252,2083971,390421
Average2,0792551,007817

Ratings & Review

Share your experiences and thoughts about University of South Carolina Beaufort. It will be a great help to applicants and prospective students!