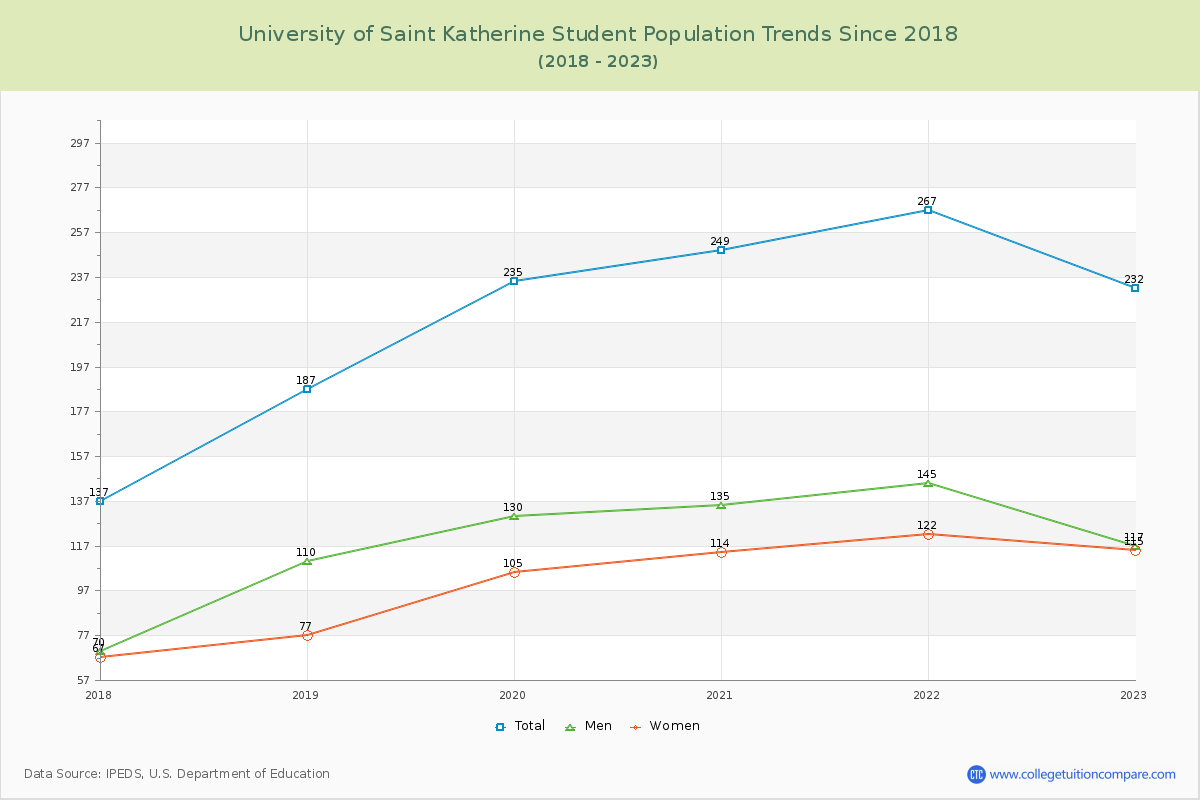
Student Population Changes
The average student population over the last 7 years is 218 where 232 students are attending the school for the academic year 2022-2023.
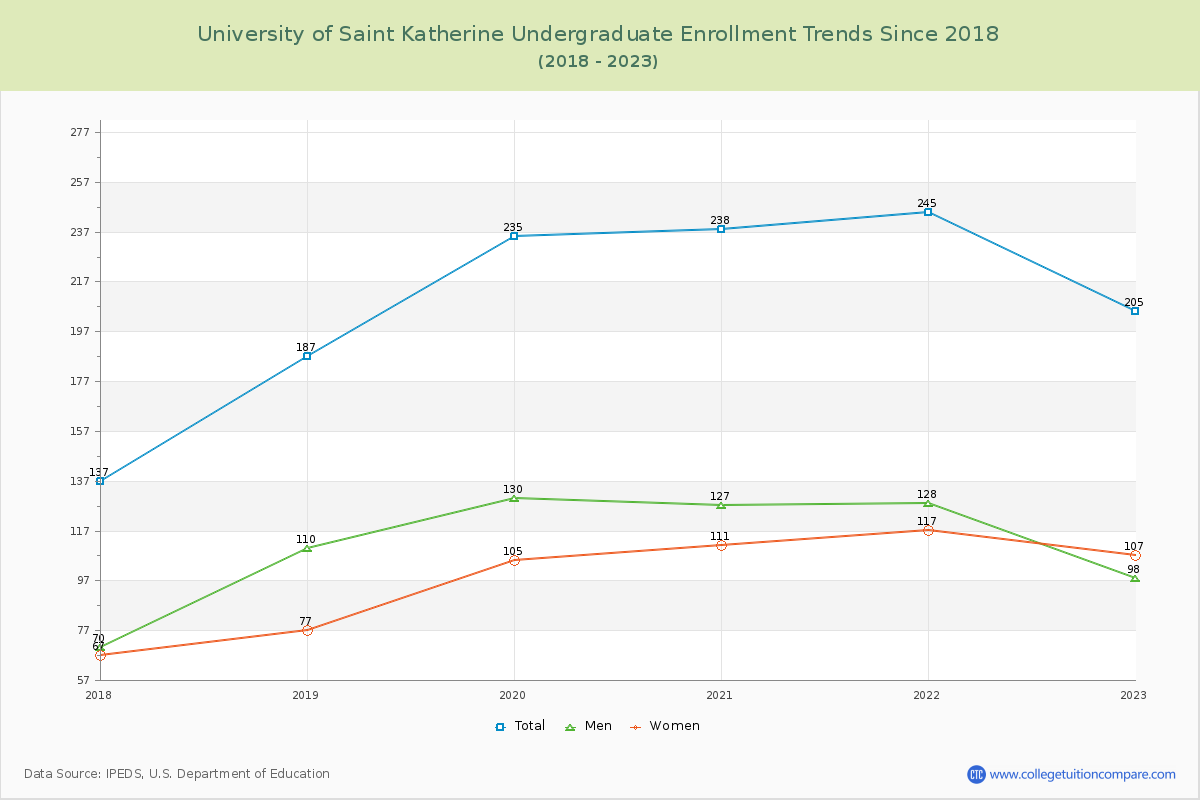
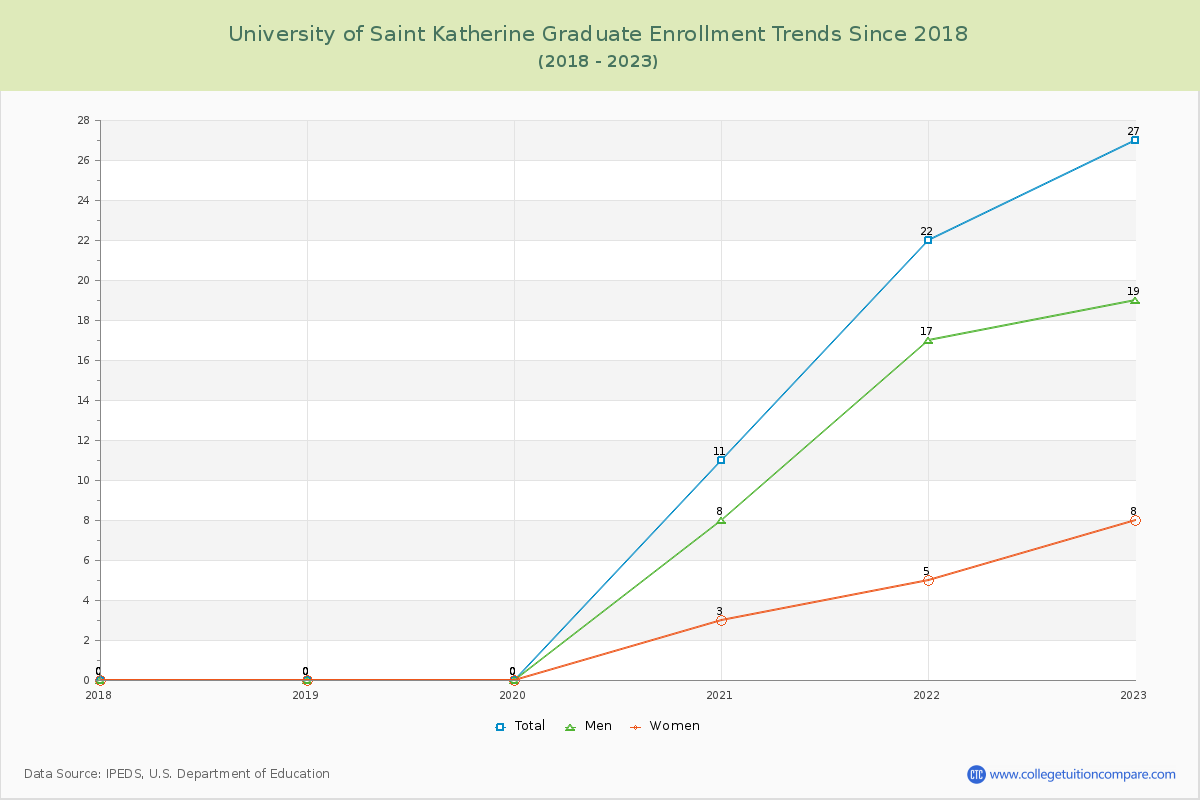
88.36% of total students is undergraduate students and 11.64% students is graduate students. The number of undergraduate students has increased by 68 and the graduate enrollment has increased by 27 over past 10 years.
The female to male ratio is 0.98 to 1 and it means that there are similar numbers of female and male students enrolled in U of Saint Katherine.
The following table and chart illustrate the changes in student population by gender at University of Saint Katherine since 2017.
| Year | Total | Undergraduate | Graduate | ||||
|---|---|---|---|---|---|---|---|
| Total | Men | Women | Total | Men | Women | ||
| 2017-18 | 137 | 137 | 70 | 67 | 0 | 0 | 0 |
| 2018-19 | 187 50 | 187 50 | 110 40 | 77 10 | 0 0 | 0 0 | 0 0 |
| 2019-20 | 235 48 | 235 48 | 130 20 | 105 28 | 0 0 | 0 0 | 0 0 |
| 2020-21 | 249 14 | 238 3 | 127 -3 | 111 6 | 11 11 | 8 8 | 3 3 |
| 2021-22 | 267 18 | 245 7 | 128 1 | 117 6 | 22 11 | 17 9 | 5 2 |
| 2022-23 | 232 -35 | 205 -40 | 98 -30 | 107 -10 | 27 5 | 19 2 | 8 3 |
| Average | 218 | 208 | 111 | 97 | 10 | 7 | 3 |