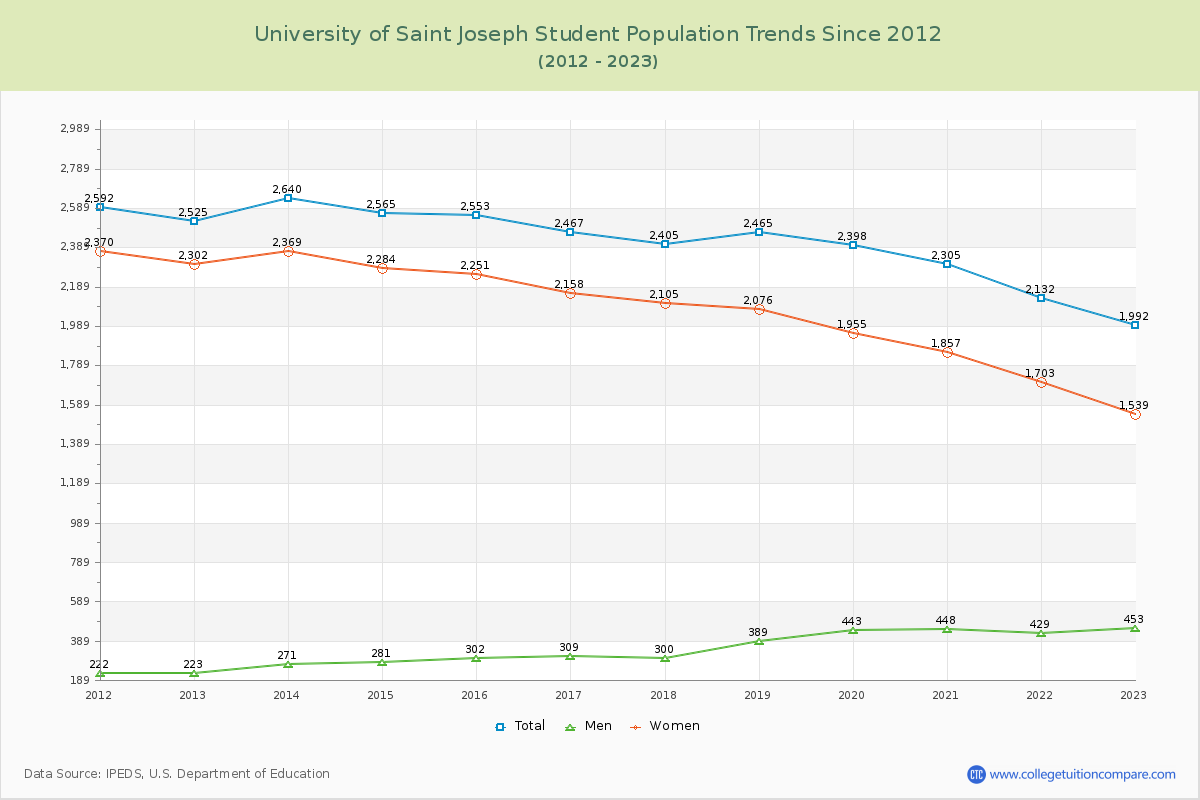
Student Population Changes
The average student population over the last 12 years is 2,404 where 1,992 students are attending the school for the academic year 2022-2023.
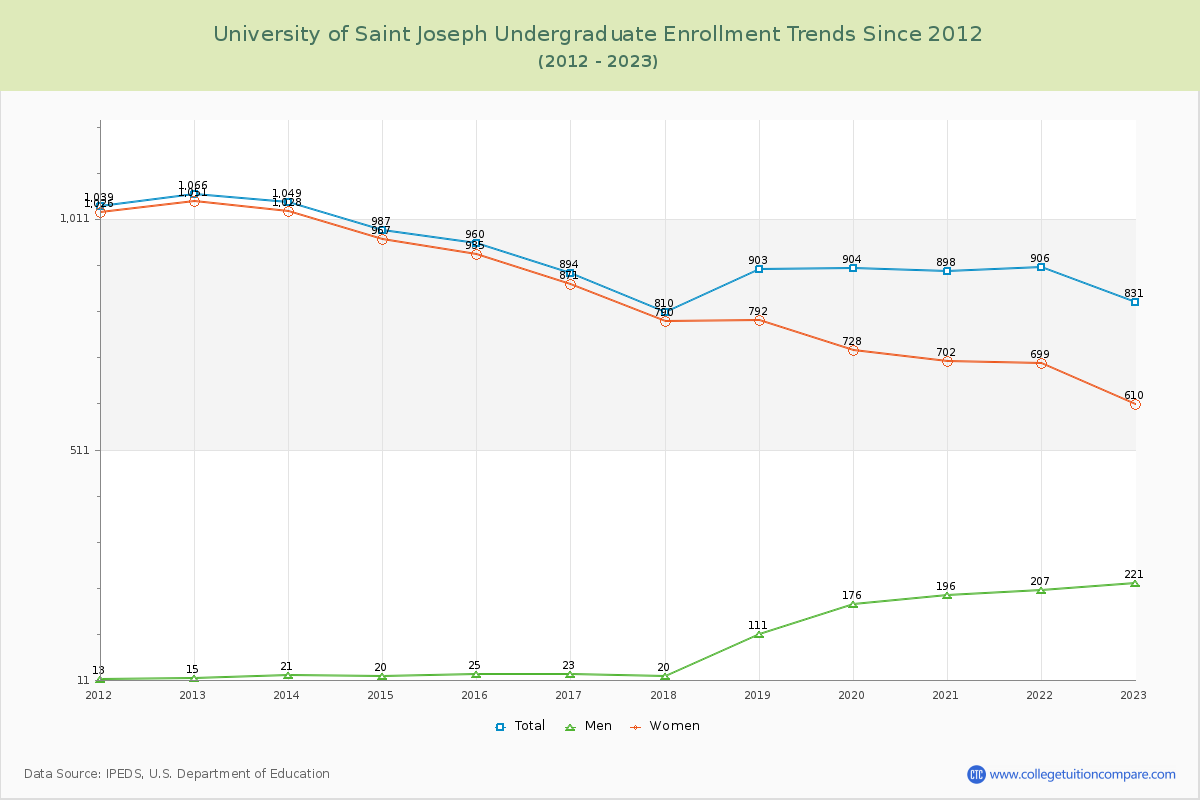
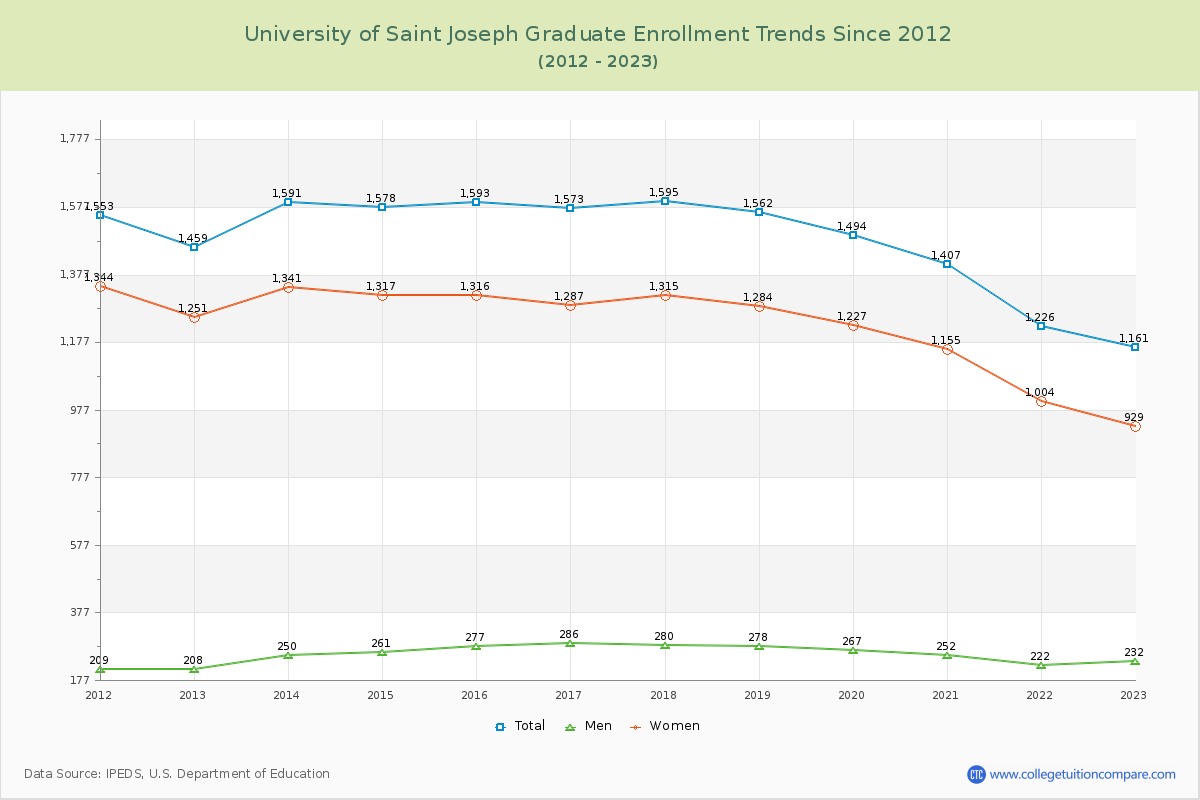
41.72% of total students is undergraduate students and 58.28% students is graduate students. The number of undergraduate students has decreased by 235 and the graduate enrollment has decreased by 298 over past 10 years.
The female to male ratio is 3.40 to 1 and it means that there are far more female students enrolled in USJ than male students.
The following table and chart illustrate the changes in student population by gender at University of Saint Joseph since 2012.
| Year | Total | Undergraduate | Graduate | ||||
|---|---|---|---|---|---|---|---|
| Total | Men | Women | Total | Men | Women | ||
| 2012-13 | 2,525 | 1,066 | 15 | 1,051 | 1,459 | 208 | 1,251 |
| 2013-14 | 2,640 115 | 1,049 -17 | 21 6 | 1,028 -23 | 1,591 132 | 250 42 | 1,341 90 |
| 2014-15 | 2,565 -75 | 987 -62 | 20 -1 | 967 -61 | 1,578 -13 | 261 11 | 1,317 -24 |
| 2015-16 | 2,553 -12 | 960 -27 | 25 5 | 935 -32 | 1,593 15 | 277 16 | 1,316 -1 |
| 2016-17 | 2,467 -86 | 894 -66 | 23 -2 | 871 -64 | 1,573 -20 | 286 9 | 1,287 -29 |
| 2017-18 | 2,405 -62 | 810 -84 | 20 -3 | 790 -81 | 1,595 22 | 280 -6 | 1,315 28 |
| 2018-19 | 2,465 60 | 903 93 | 111 91 | 792 2 | 1,562 -33 | 278 -2 | 1,284 -31 |
| 2019-20 | 2,398 -67 | 904 1 | 176 65 | 728 -64 | 1,494 -68 | 267 -11 | 1,227 -57 |
| 2020-21 | 2,305 -93 | 898 -6 | 196 20 | 702 -26 | 1,407 -87 | 252 -15 | 1,155 -72 |
| 2021-22 | 2,132 -173 | 906 8 | 207 11 | 699 -3 | 1,226 -181 | 222 -30 | 1,004 -151 |
| 2022-23 | 1,992 -140 | 831 -75 | 221 14 | 610 -89 | 1,161 -65 | 232 10 | 929 -75 |
| Average | 2,404 | 928 | 94 | 834 | 1,476 | 256 | 1,221 |