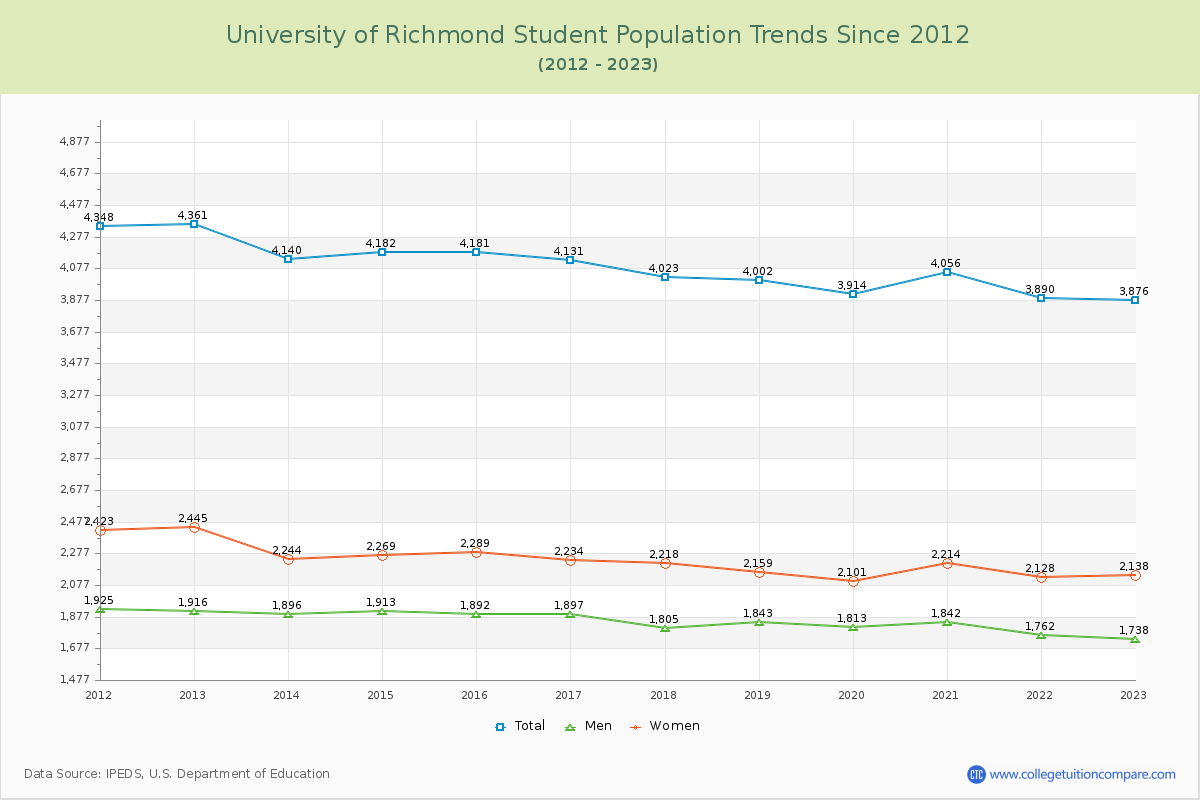
Student Population Changes
The average student population over the last 12 years is 4,069 where 3,876 students are attending the school for the academic year 2022-2023.
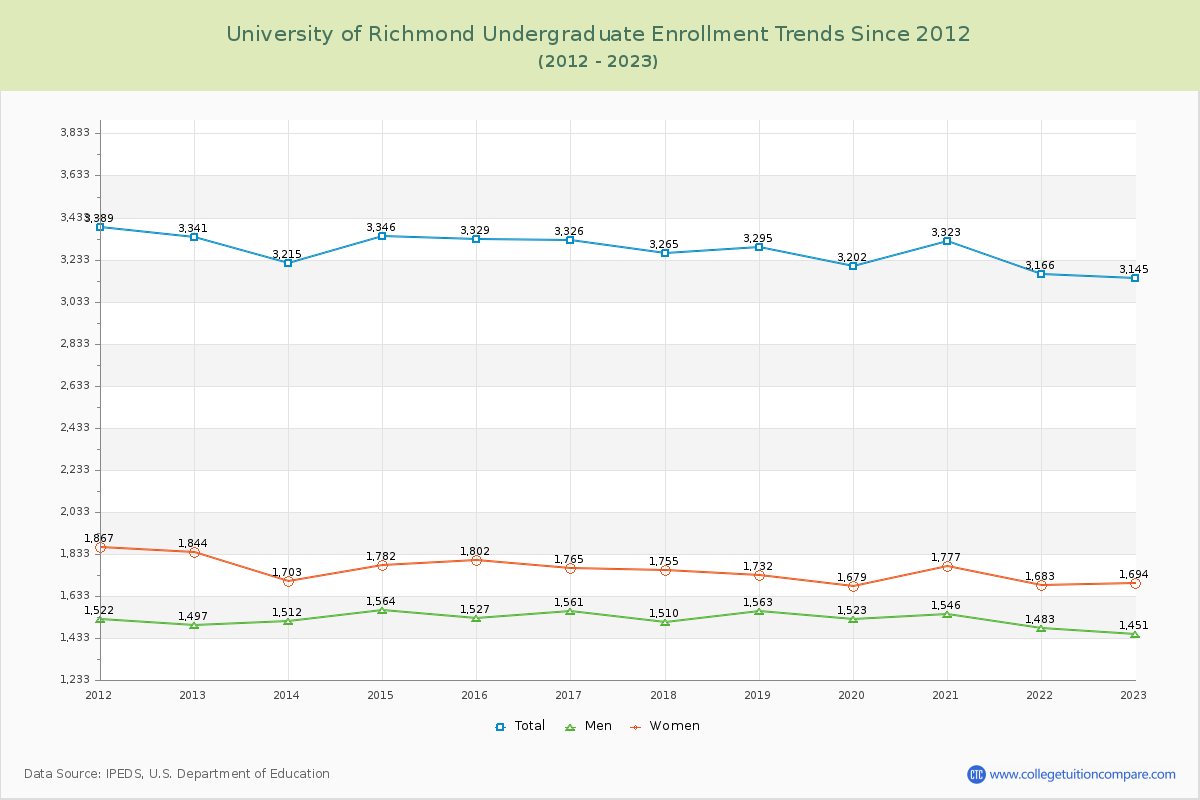
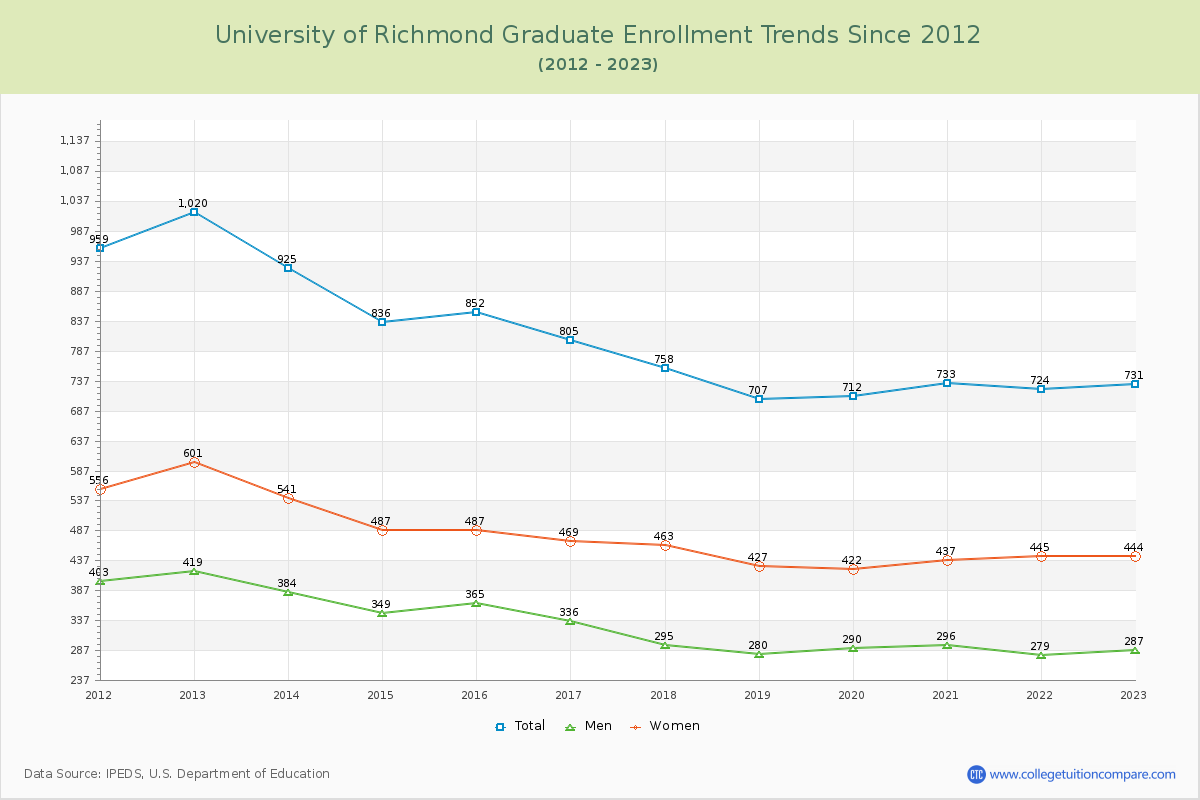
81.14% of total students is undergraduate students and 18.86% students is graduate students. The number of undergraduate students has decreased by 196 and the graduate enrollment has decreased by 289 over past 10 years.
The female to male ratio is 1.23 to 1 and it means that there are slightly more female students enrolled in UR than male students.
The following table and chart illustrate the changes in student population by gender at University of Richmond since 2012.
| Year | Total | Undergraduate | Graduate | ||||
|---|---|---|---|---|---|---|---|
| Total | Men | Women | Total | Men | Women | ||
| 2012-13 | 4,361 | 3,341 | 1,497 | 1,844 | 1,020 | 419 | 601 |
| 2013-14 | 4,140 -221 | 3,215 -126 | 1,512 15 | 1,703 -141 | 925 -95 | 384 -35 | 541 -60 |
| 2014-15 | 4,182 42 | 3,346 131 | 1,564 52 | 1,782 79 | 836 -89 | 349 -35 | 487 -54 |
| 2015-16 | 4,181 -1 | 3,329 -17 | 1,527 -37 | 1,802 20 | 852 16 | 365 16 | 487 0 |
| 2016-17 | 4,131 -50 | 3,326 -3 | 1,561 34 | 1,765 -37 | 805 -47 | 336 -29 | 469 -18 |
| 2017-18 | 4,023 -108 | 3,265 -61 | 1,510 -51 | 1,755 -10 | 758 -47 | 295 -41 | 463 -6 |
| 2018-19 | 4,002 -21 | 3,295 30 | 1,563 53 | 1,732 -23 | 707 -51 | 280 -15 | 427 -36 |
| 2019-20 | 3,914 -88 | 3,202 -93 | 1,523 -40 | 1,679 -53 | 712 5 | 290 10 | 422 -5 |
| 2020-21 | 4,056 142 | 3,323 121 | 1,546 23 | 1,777 98 | 733 21 | 296 6 | 437 15 |
| 2021-22 | 3,890 -166 | 3,166 -157 | 1,483 -63 | 1,683 -94 | 724 -9 | 279 -17 | 445 8 |
| 2022-23 | 3,876 -14 | 3,145 -21 | 1,451 -32 | 1,694 11 | 731 7 | 287 8 | 444 -1 |
| Average | 4,069 | 3,268 | 1,522 | 1,747 | 800 | 325 | 475 |