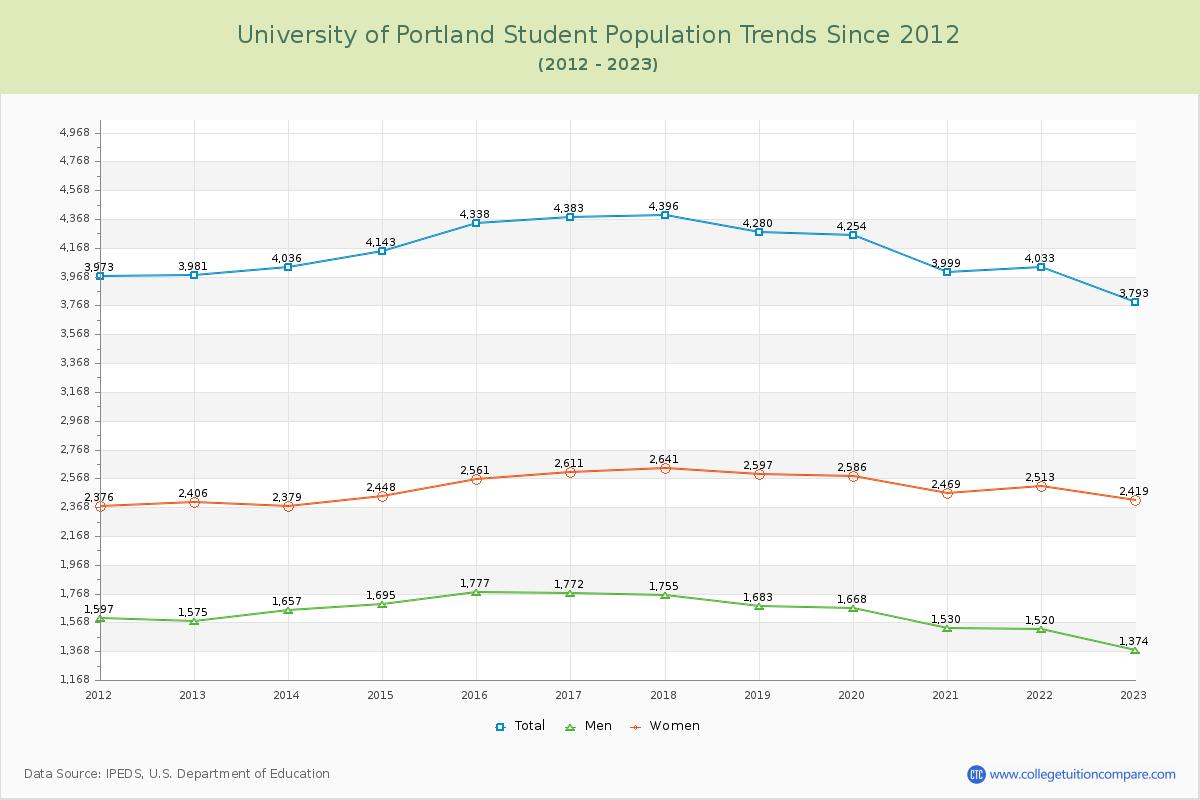
Student Population Changes
The average student population over the last 12 years is 4,149 where 3,793 students are attending the school for the academic year 2022-2023.
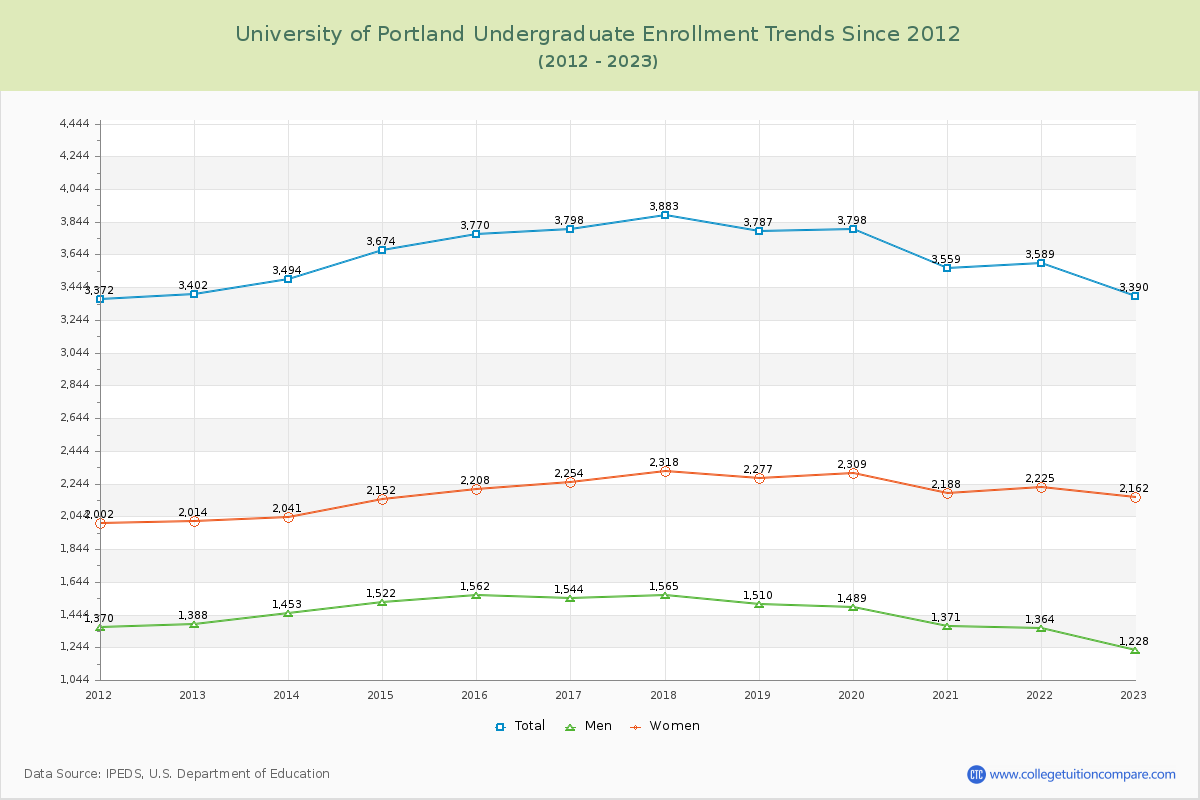
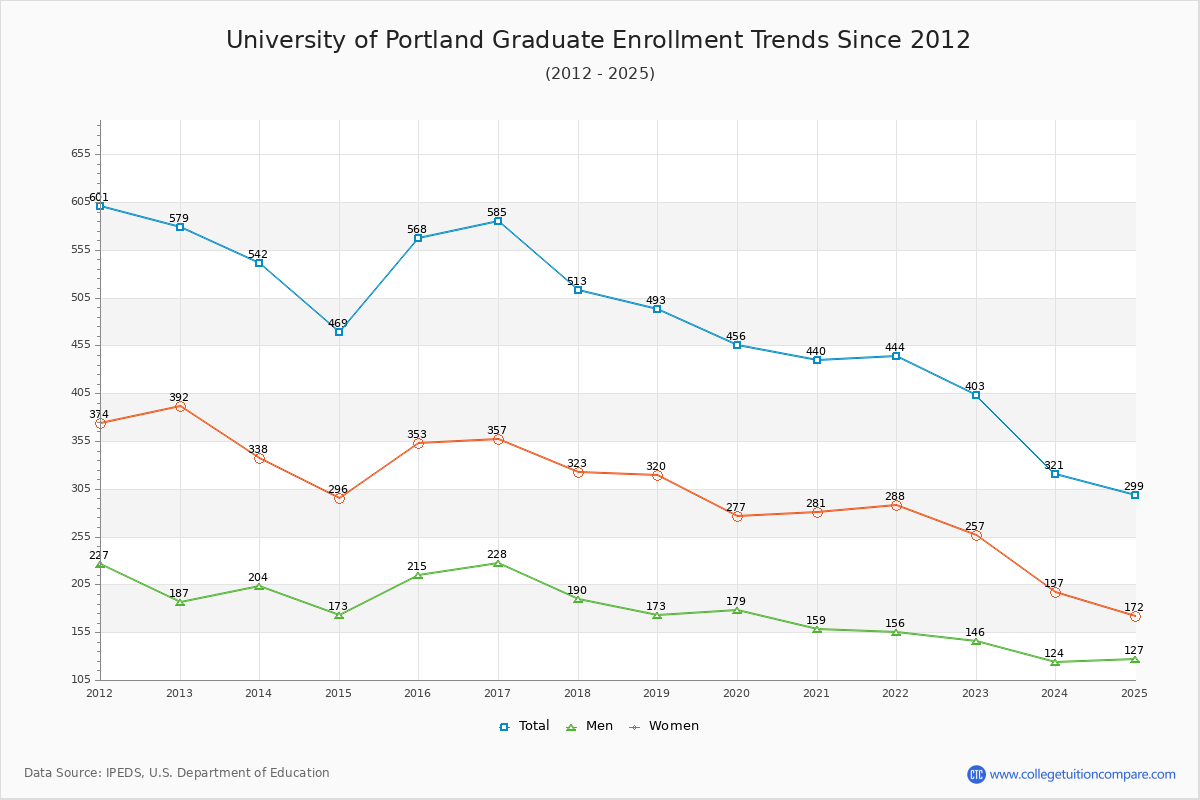
89.38% of total students is undergraduate students and 10.62% students is graduate students. The number of undergraduate students has decreased by 12 and the graduate enrollment has decreased by 176 over past 10 years.
The female to male ratio is 1.76 to 1 and it means that there are more female students enrolled in UP than male students.
The following table and chart illustrate the changes in student population by gender at University of Portland since 2012.
| Year | Total | Undergraduate | Graduate | ||||
|---|---|---|---|---|---|---|---|
| Total | Men | Women | Total | Men | Women | ||
| 2012-13 | 3,981 | 3,402 | 1,388 | 2,014 | 579 | 187 | 392 |
| 2013-14 | 4,036 55 | 3,494 92 | 1,453 65 | 2,041 27 | 542 -37 | 204 17 | 338 -54 |
| 2014-15 | 4,143 107 | 3,674 180 | 1,522 69 | 2,152 111 | 469 -73 | 173 -31 | 296 -42 |
| 2015-16 | 4,338 195 | 3,770 96 | 1,562 40 | 2,208 56 | 568 99 | 215 42 | 353 57 |
| 2016-17 | 4,383 45 | 3,798 28 | 1,544 -18 | 2,254 46 | 585 17 | 228 13 | 357 4 |
| 2017-18 | 4,396 13 | 3,883 85 | 1,565 21 | 2,318 64 | 513 -72 | 190 -38 | 323 -34 |
| 2018-19 | 4,280 -116 | 3,787 -96 | 1,510 -55 | 2,277 -41 | 493 -20 | 173 -17 | 320 -3 |
| 2019-20 | 4,254 -26 | 3,798 11 | 1,489 -21 | 2,309 32 | 456 -37 | 179 6 | 277 -43 |
| 2020-21 | 3,999 -255 | 3,559 -239 | 1,371 -118 | 2,188 -121 | 440 -16 | 159 -20 | 281 4 |
| 2021-22 | 4,033 34 | 3,589 30 | 1,364 -7 | 2,225 37 | 444 4 | 156 -3 | 288 7 |
| 2022-23 | 3,793 -240 | 3,390 -199 | 1,228 -136 | 2,162 -63 | 403 -41 | 146 -10 | 257 -31 |
| Average | 4,149 | 3,649 | 1,454 | 2,195 | 499 | 183 | 317 |