Enrollment Trends at Pitt-Titusville

-310

Total Enrollment

-110

Men

-200

Women

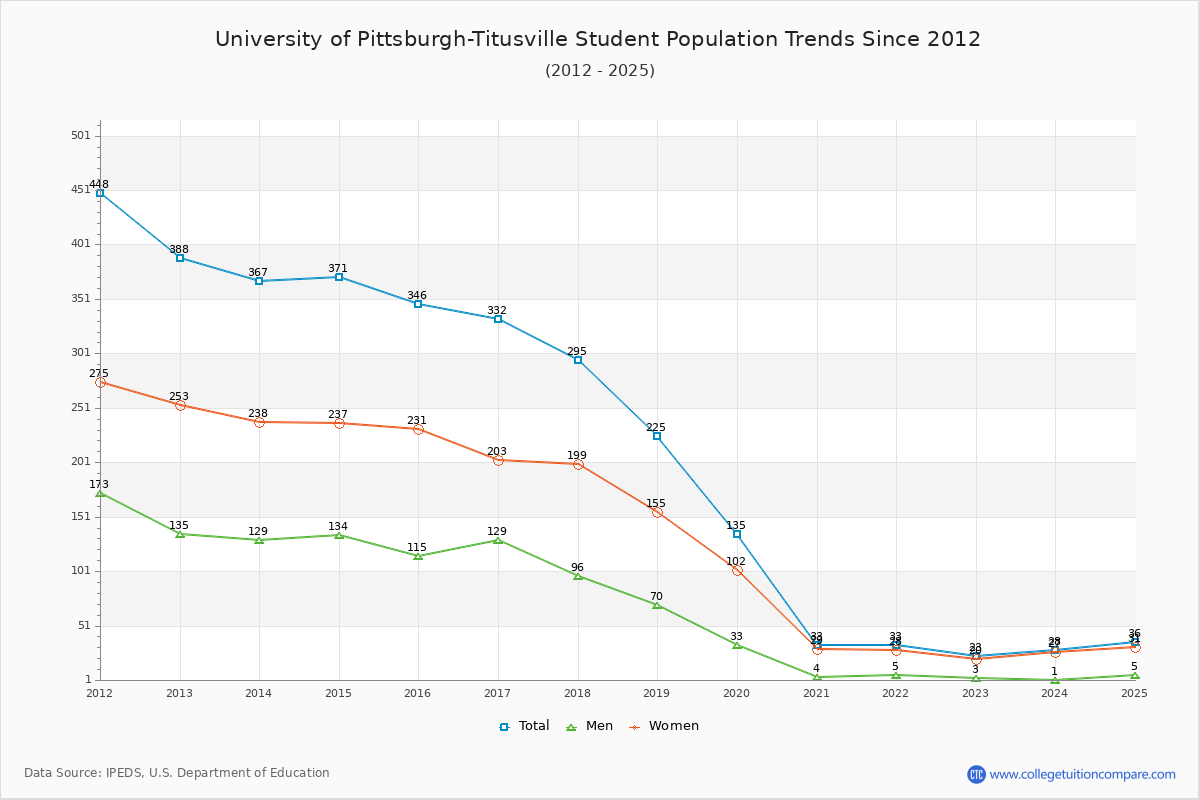
The student population at University of Pittsburgh-Titusville is 36 (all undergraduate). The number of students has decreased by 310 over the past decade.

The female to male ratio is 6.20 to 1 which means that majority of population is on female students.

All students have enrolled in on-campus classes (University of Pittsburgh-Titusville does not offer online degree/certificate program).

Student Population Changes

The average student population over the last 11 years is 149 where 36 students are attending the school for the academic year 2024-2025.

The female to male ratio is 6.20 to 1 and it means that there are far more female students enrolled in Pitt-Titusville than male students.

The following table and chart illustrate the changes in student population by gender at University of Pittsburgh-Titusville since 2015.

YearTotalMenWomen
2015-16346115231
2016-17332
-14
129
14
203
-28
2017-18295
-37
96
-33
199
-4
2018-19225
-70
70
-26
155
-44
2019-20135
-90
33
-37
102
-53
2020-2133
-102
4
-29
29
-73
2021-22335
1
28
-1
2022-2323
-10
3
-2
20
-8
2023-2428
5
1
-2
27
7
2024-2536
8
5
4
31
4
Average14946103
University of Pittsburgh-Titusville Enrollment Trends Chart

Enrollment by Race/Ethnicity Changes

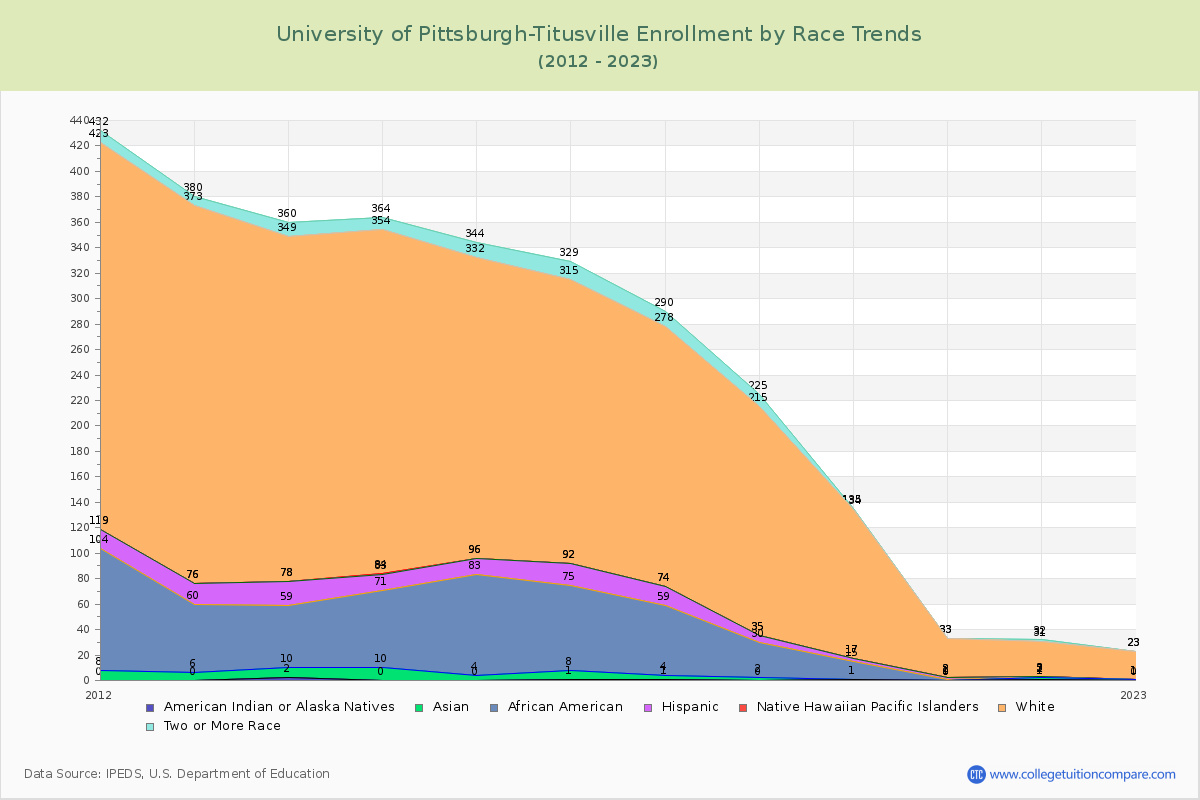
The percentage of white students is 86.11%. The percentage was 68.21% 10 years ago and Pitt-Titusville still has a high percentage of white students. 5.56% of enrolled students is Asian and 0.00% is black students.

Over the past 10 years, the racial composition has shifted. The percentage of white students increased from 68.21% to 86.11%. Asian enrollment grew from 1.16% to 5.56%.

The overall racial diversity, measured by the Census Bureau Diversity Index, is 0.2546 which indicates that not very diverse. This decreased from 0.4799 a decade ago, suggesting that racial diversity has declined.

The following table and chart illustrate the student population trends by race/ethnicity at University of Pittsburgh-Titusville over the past 11 years (2015-2025).

YearAmerican Indian or Native AmericanAsianBlackHispanicNative Hawaiian or Other Pacific IslanderWhiteTwo or More Races
2015-16047913023612
2016-17176717022314
2017-18135515020412
2018-1902285018010
2019-201014201171
2020-2100110310
2021-2211010281
2022-2301000220
2023-2401100203
2024-2502000311
Average0225501095
University of Pittsburgh-Titusville Enrollment by Race Trends Chart

Distance Learning (Online Courses) Enrollment Changes

University of Pittsburgh-Titusville does not offer online degree/certificate programs. All Students have enrolled in on-campus programs.


Ratings & Review

Share your experiences and thoughts about University of Pittsburgh-Titusville. It will be a great help to applicants and prospective students!