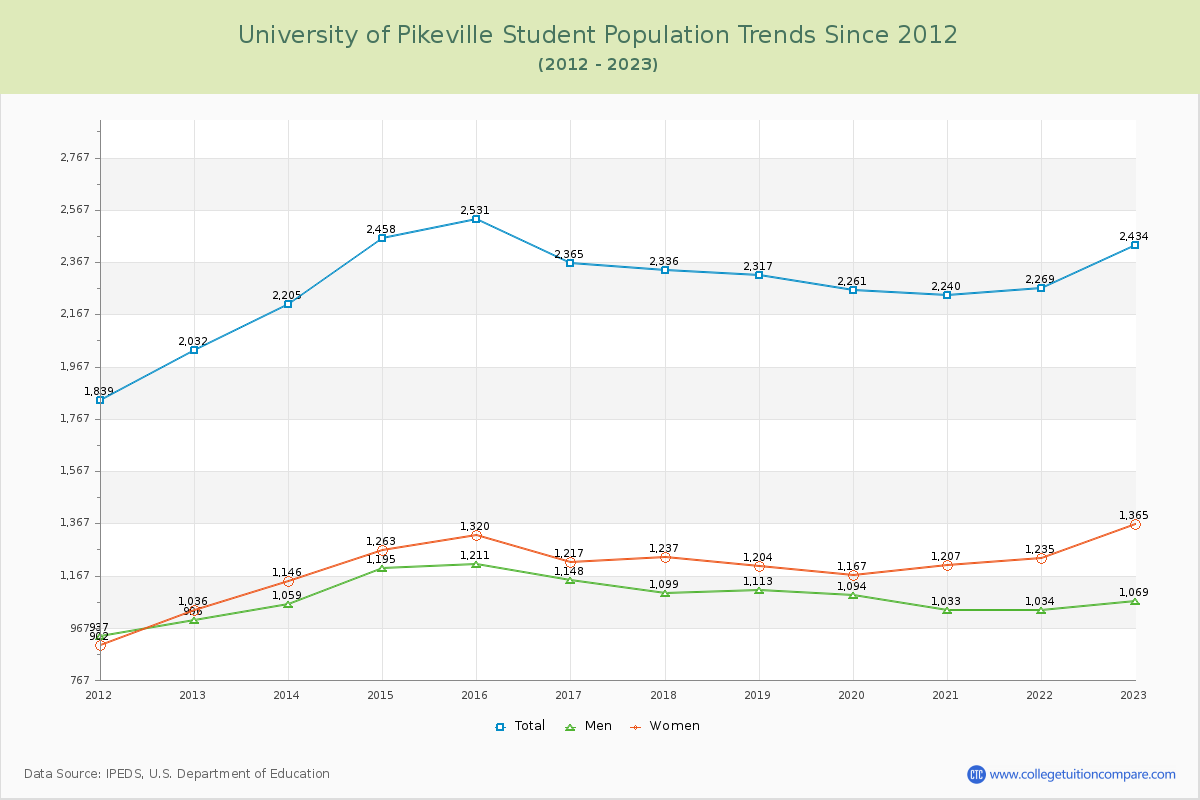
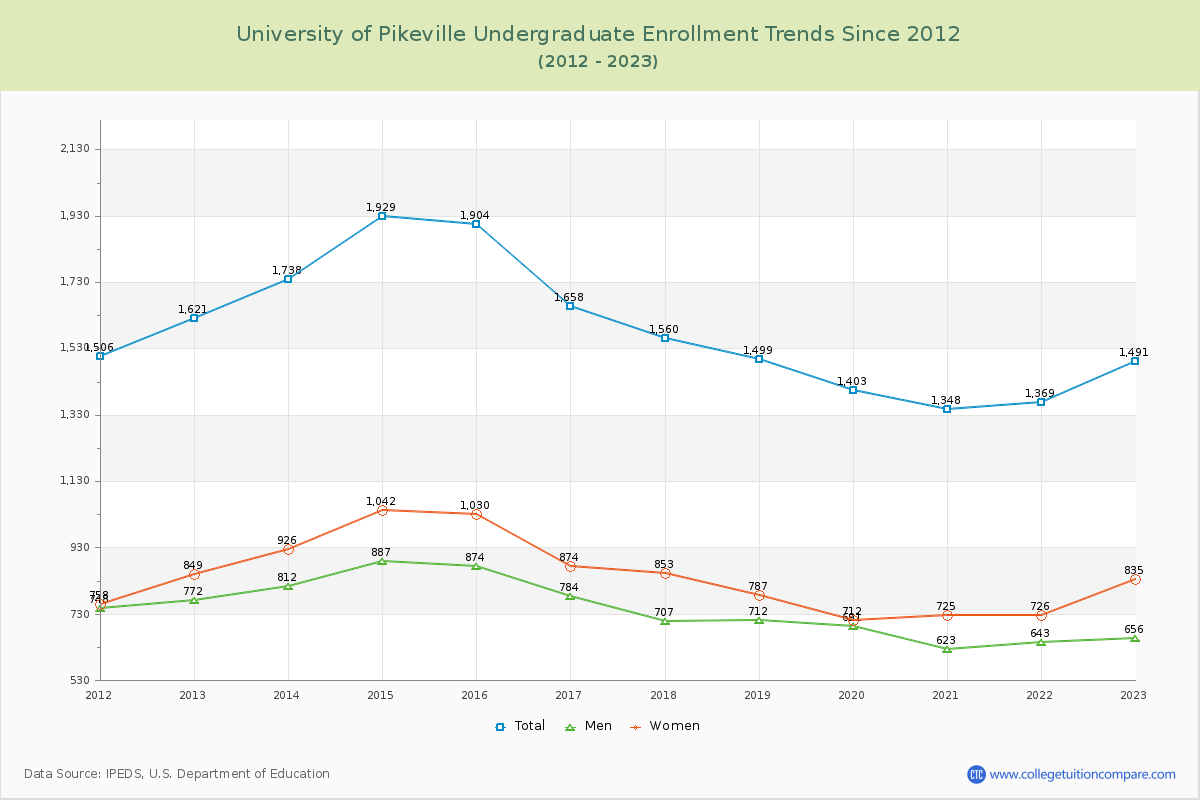
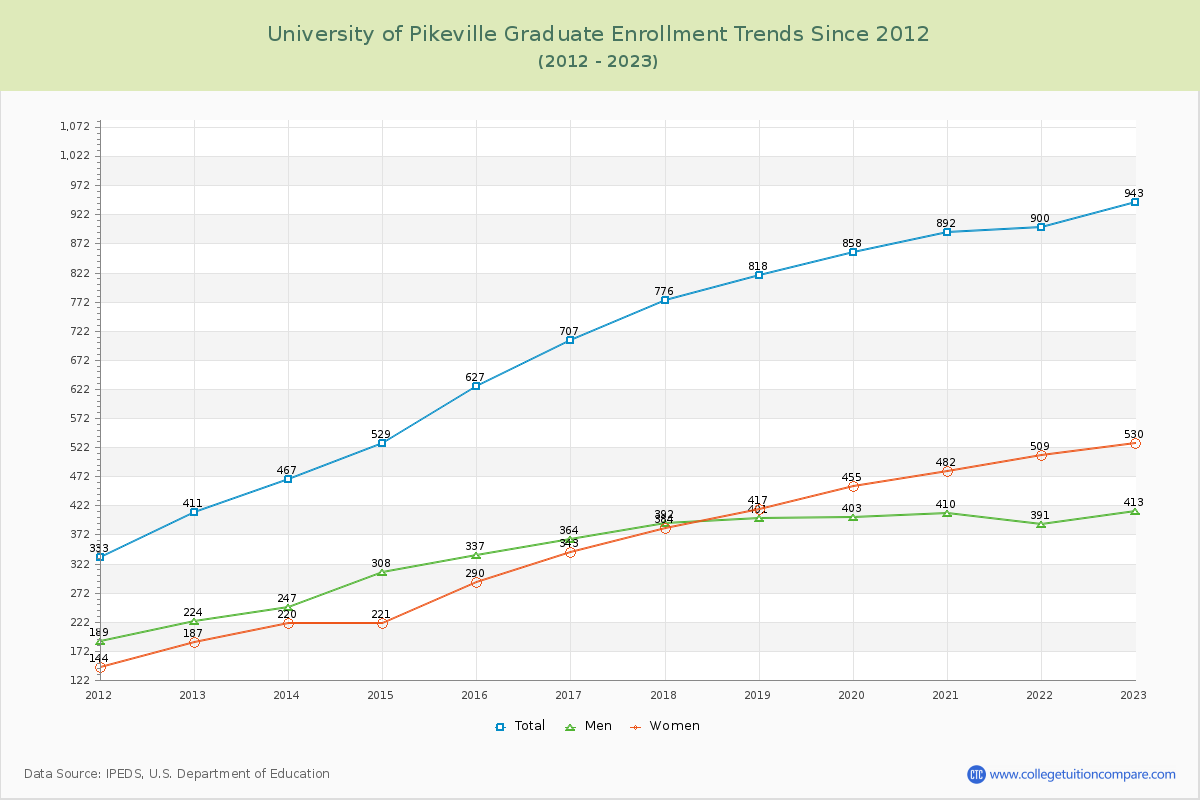
Student Population Changes
The average student population over the last 12 years is 2,313 where 2,434 students are attending the school for the academic year 2022-2023.
61.26% of total students is undergraduate students and 38.74% students is graduate students. The number of undergraduate students has decreased by 130 and the graduate enrollment has increased by 532 over past 10 years.
The female to male ratio is 1.28 to 1 and it means that there are slightly more female students enrolled in UPIKE than male students.
The following table and chart illustrate the changes in student population by gender at University of Pikeville since 2012.
| Year | Total | Undergraduate | Graduate | ||||
|---|---|---|---|---|---|---|---|
| Total | Men | Women | Total | Men | Women | ||
| 2012-13 | 2,032 | 1,621 | 772 | 849 | 411 | 224 | 187 |
| 2013-14 | 2,205 173 | 1,738 117 | 812 40 | 926 77 | 467 56 | 247 23 | 220 33 |
| 2014-15 | 2,458 253 | 1,929 191 | 887 75 | 1,042 116 | 529 62 | 308 61 | 221 1 |
| 2015-16 | 2,531 73 | 1,904 -25 | 874 -13 | 1,030 -12 | 627 98 | 337 29 | 290 69 |
| 2016-17 | 2,365 -166 | 1,658 -246 | 784 -90 | 874 -156 | 707 80 | 364 27 | 343 53 |
| 2017-18 | 2,336 -29 | 1,560 -98 | 707 -77 | 853 -21 | 776 69 | 392 28 | 384 41 |
| 2018-19 | 2,317 -19 | 1,499 -61 | 712 5 | 787 -66 | 818 42 | 401 9 | 417 33 |
| 2019-20 | 2,261 -56 | 1,403 -96 | 691 -21 | 712 -75 | 858 40 | 403 2 | 455 38 |
| 2020-21 | 2,240 -21 | 1,348 -55 | 623 -68 | 725 13 | 892 34 | 410 7 | 482 27 |
| 2021-22 | 2,269 29 | 1,369 21 | 643 20 | 726 1 | 900 8 | 391 -19 | 509 27 |
| 2022-23 | 2,434 165 | 1,491 122 | 656 13 | 835 109 | 943 43 | 413 22 | 530 21 |
| Average | 2,313 | 1,593 | 742 | 851 | 721 | 354 | 367 |