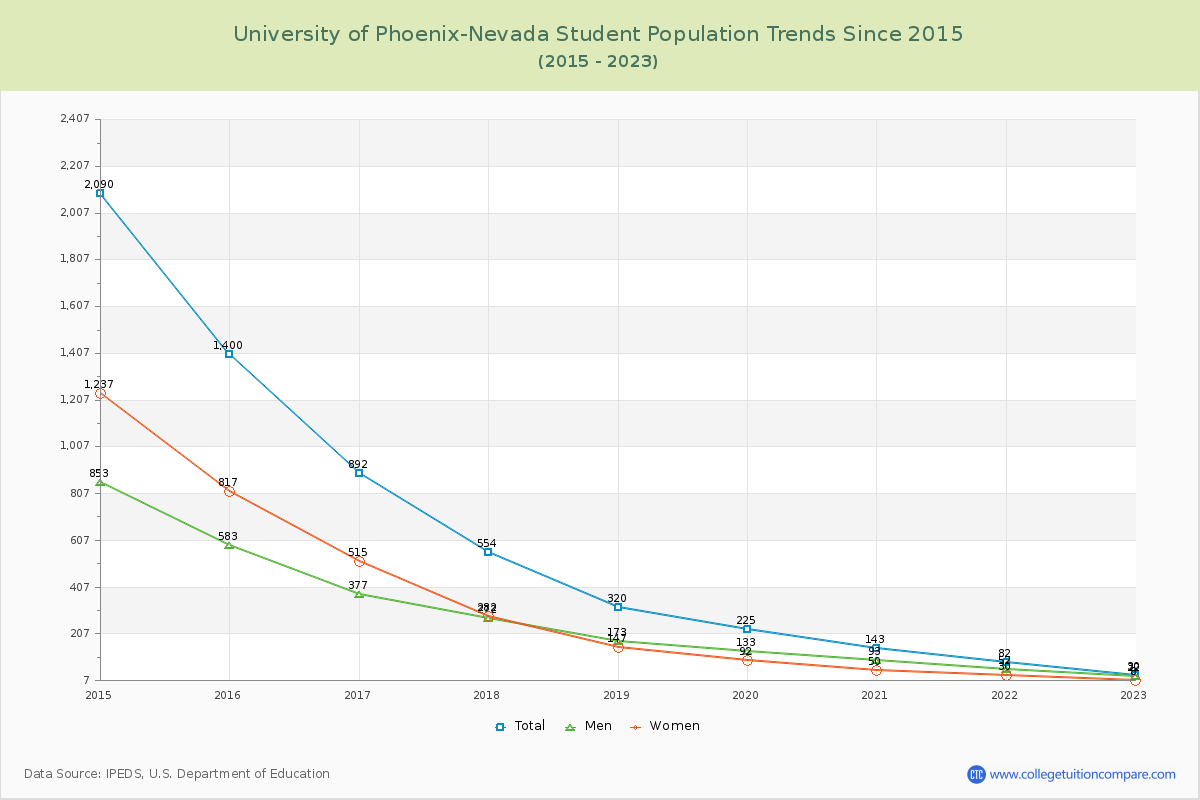
Student Population Changes
The average student population over the last 10 years is 637 where 30 students are attending the school for the academic year 2022-2023.
The female to male ratio is 0.36 to 1 and it means that there are far more male students enrolled in U of Phoenix-Nevada than female students.
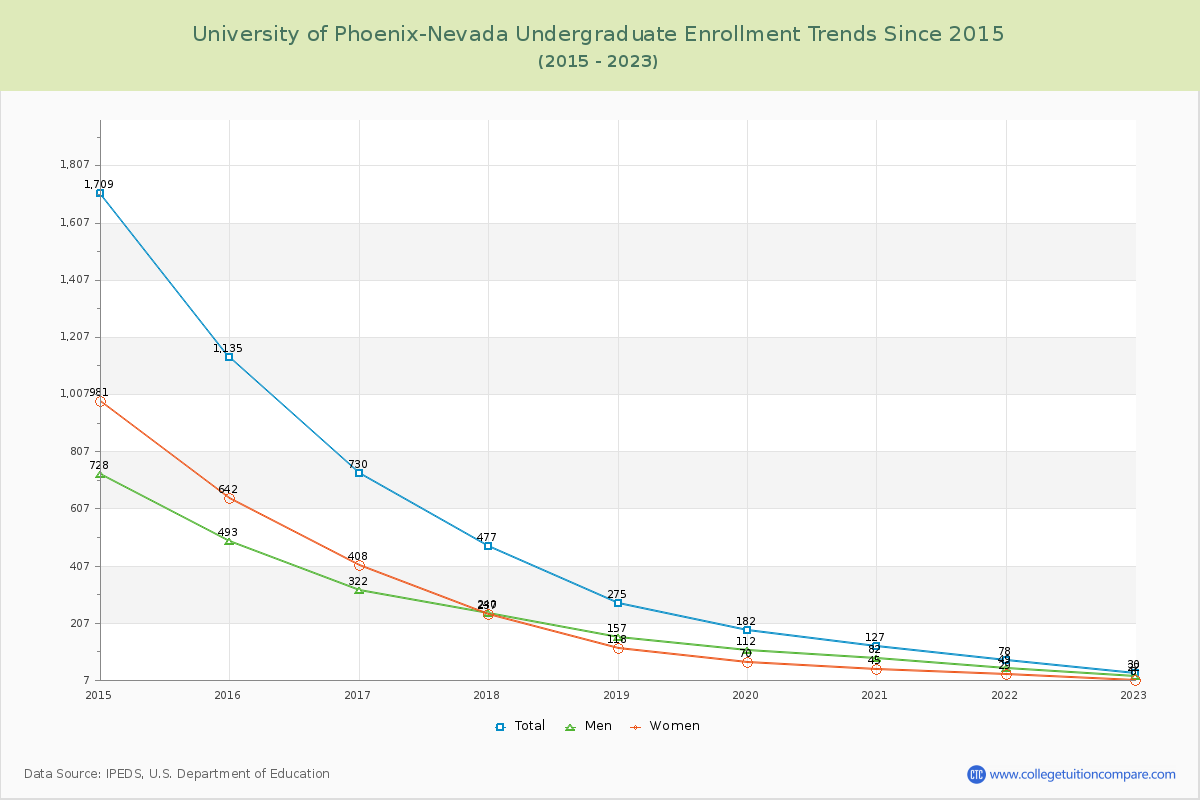
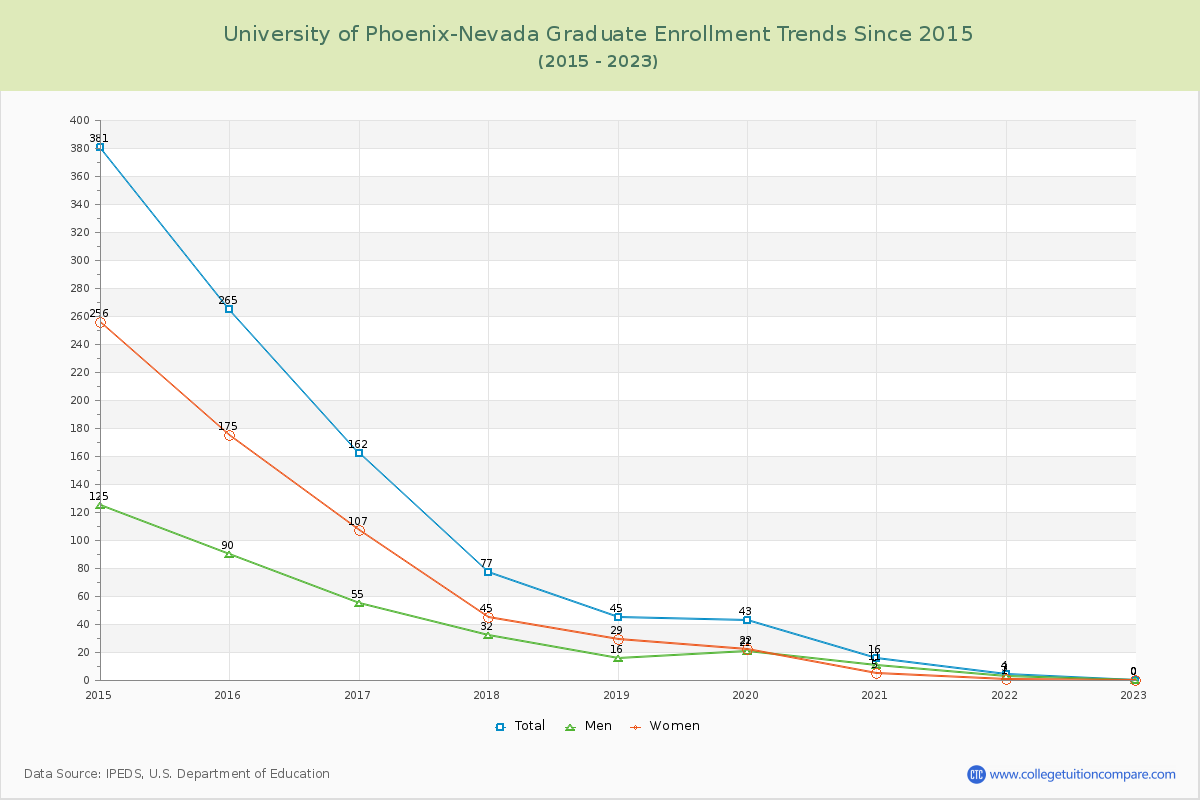
The following table and chart illustrate the changes in student population by gender at University of Phoenix-Nevada since 2014.
| Year | Total | Undergraduate | Graduate | ||||
|---|---|---|---|---|---|---|---|
| Total | Men | Women | Total | Men | Women | ||
| 2014-15 | 2,090 | 1,709 | 728 | 981 | 381 | 125 | 256 |
| 2015-16 | 1,400 -690 | 1,135 -574 | 493 -235 | 642 -339 | 265 -116 | 90 -35 | 175 -81 |
| 2016-17 | 892 -508 | 730 -405 | 322 -171 | 408 -234 | 162 -103 | 55 -35 | 107 -68 |
| 2017-18 | 554 -338 | 477 -253 | 240 -82 | 237 -171 | 77 -85 | 32 -23 | 45 -62 |
| 2018-19 | 320 -234 | 275 -202 | 157 -83 | 118 -119 | 45 -32 | 16 -16 | 29 -16 |
| 2019-20 | 225 -95 | 182 -93 | 112 -45 | 70 -48 | 43 -2 | 21 5 | 22 -7 |
| 2020-21 | 143 -82 | 127 -55 | 82 -30 | 45 -25 | 16 -27 | 11 -10 | 5 -17 |
| 2021-22 | 82 -61 | 78 -49 | 49 -33 | 29 -16 | 4 -12 | 3 -8 | 1 -4 |
| 2022-23 | 30 -52 | 30 -48 | 22 -27 | 8 -21 | 0 -4 | 0 -3 | 0 -1 |
| Average | 637 | 527 | 245 | 282 | 110 | 39 | 71 |