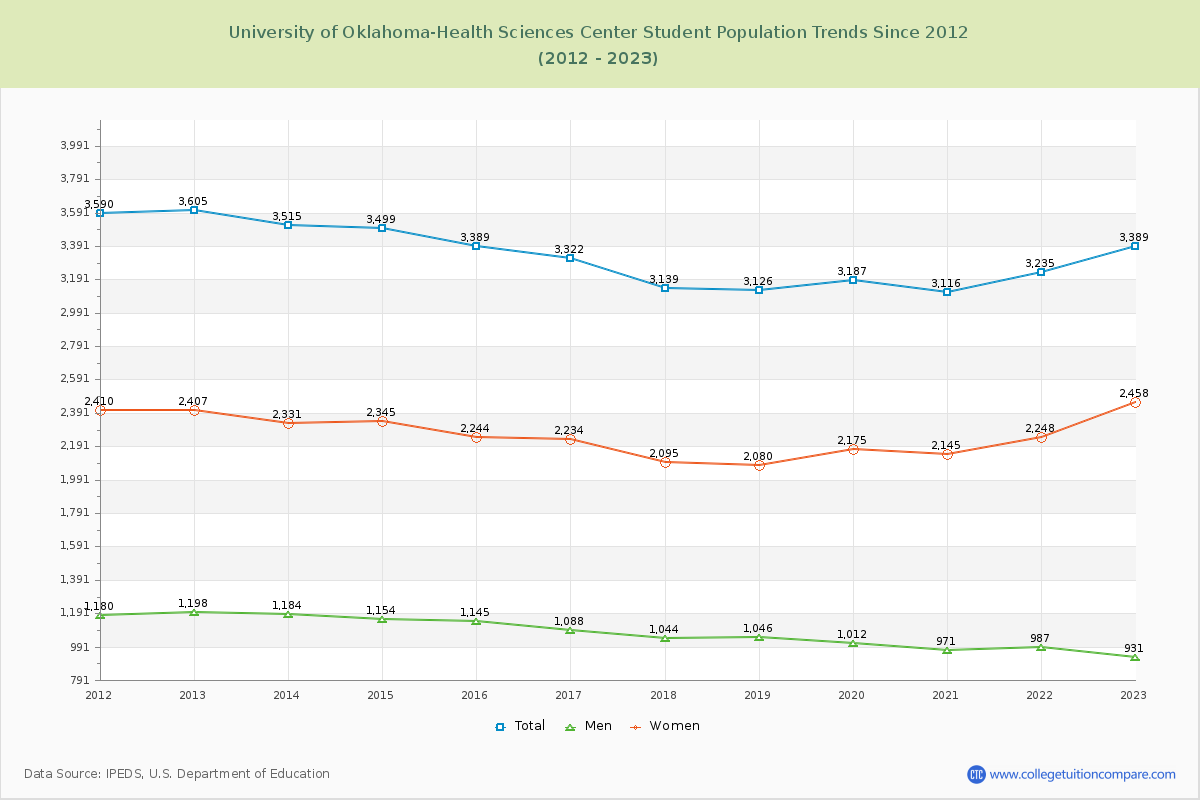
Student Population Changes
The average student population over the last 12 years is 3,320 where 3,389 students are attending the school for the academic year 2022-2023.
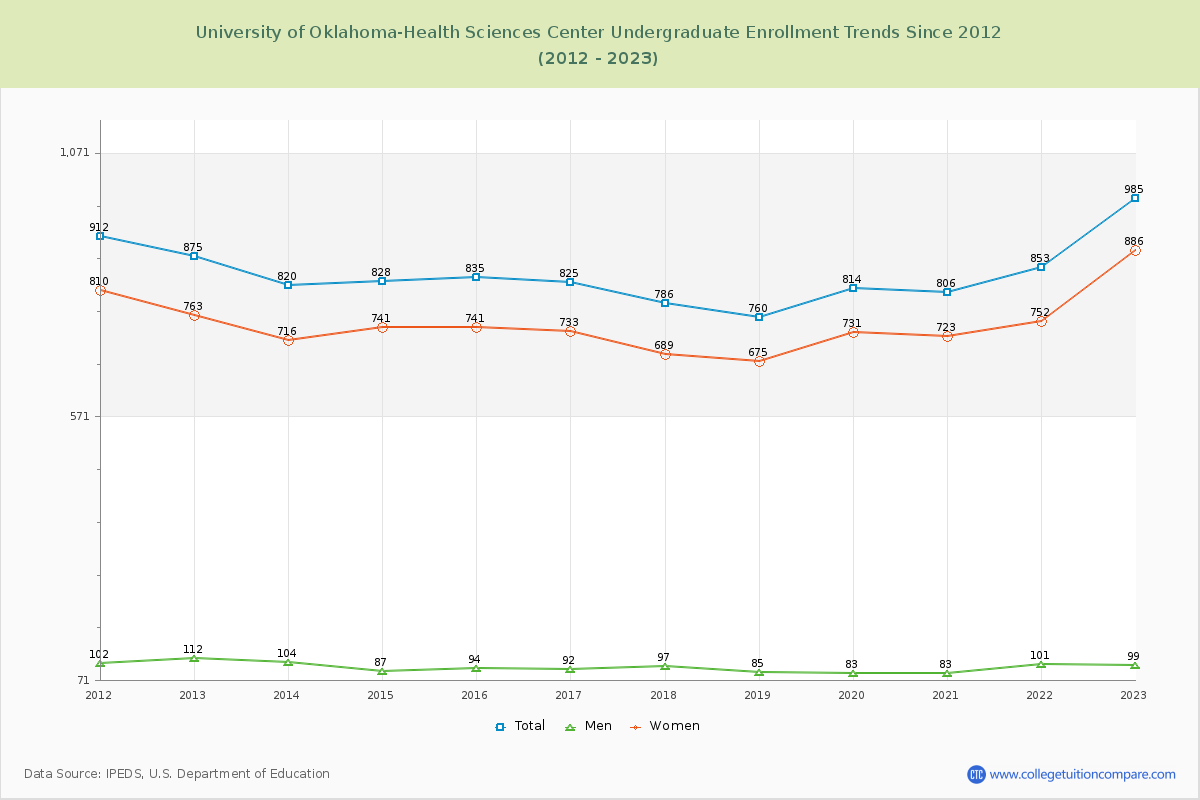
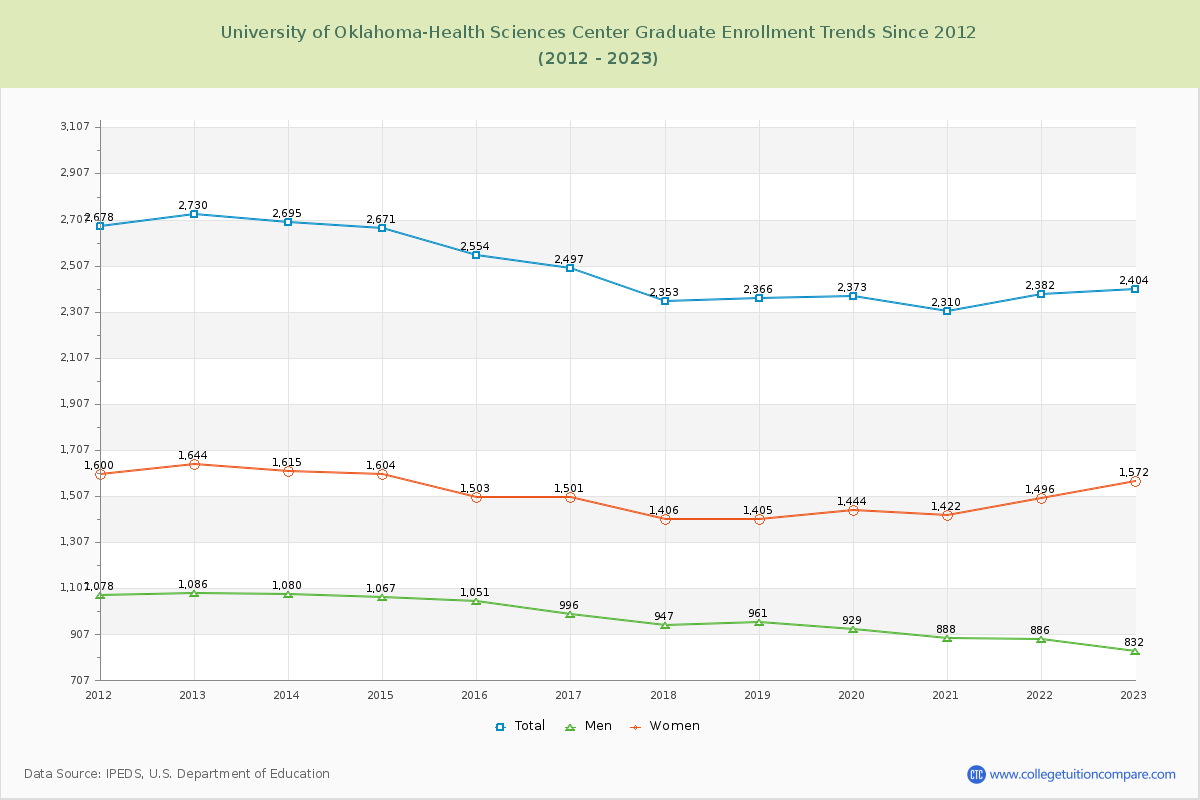
29.06% of total students is undergraduate students and 70.94% students is graduate students. The number of undergraduate students has increased by 110 and the graduate enrollment has decreased by 326 over past 10 years.
The female to male ratio is 2.64 to 1 and it means that there are far more female students enrolled in U of Oklahoma-Health Sciences Center than male students.
The following table and chart illustrate the changes in student population by gender at University of Oklahoma-Health Sciences Center since 2012.
| Year | Total | Undergraduate | Graduate | ||||
|---|---|---|---|---|---|---|---|
| Total | Men | Women | Total | Men | Women | ||
| 2012-13 | 3,605 | 875 | 112 | 763 | 2,730 | 1,086 | 1,644 |
| 2013-14 | 3,515 -90 | 820 -55 | 104 -8 | 716 -47 | 2,695 -35 | 1,080 -6 | 1,615 -29 |
| 2014-15 | 3,499 -16 | 828 8 | 87 -17 | 741 25 | 2,671 -24 | 1,067 -13 | 1,604 -11 |
| 2015-16 | 3,389 -110 | 835 7 | 94 7 | 741 0 | 2,554 -117 | 1,051 -16 | 1,503 -101 |
| 2016-17 | 3,322 -67 | 825 -10 | 92 -2 | 733 -8 | 2,497 -57 | 996 -55 | 1,501 -2 |
| 2017-18 | 3,139 -183 | 786 -39 | 97 5 | 689 -44 | 2,353 -144 | 947 -49 | 1,406 -95 |
| 2018-19 | 3,126 -13 | 760 -26 | 85 -12 | 675 -14 | 2,366 13 | 961 14 | 1,405 -1 |
| 2019-20 | 3,187 61 | 814 54 | 83 -2 | 731 56 | 2,373 7 | 929 -32 | 1,444 39 |
| 2020-21 | 3,116 -71 | 806 -8 | 83 0 | 723 -8 | 2,310 -63 | 888 -41 | 1,422 -22 |
| 2021-22 | 3,235 119 | 853 47 | 101 18 | 752 29 | 2,382 72 | 886 -2 | 1,496 74 |
| 2022-23 | 3,389 154 | 985 132 | 99 -2 | 886 134 | 2,404 22 | 832 -54 | 1,572 76 |
| Average | 3,320 | 835 | 94 | 741 | 2,485 | 975 | 1,510 |