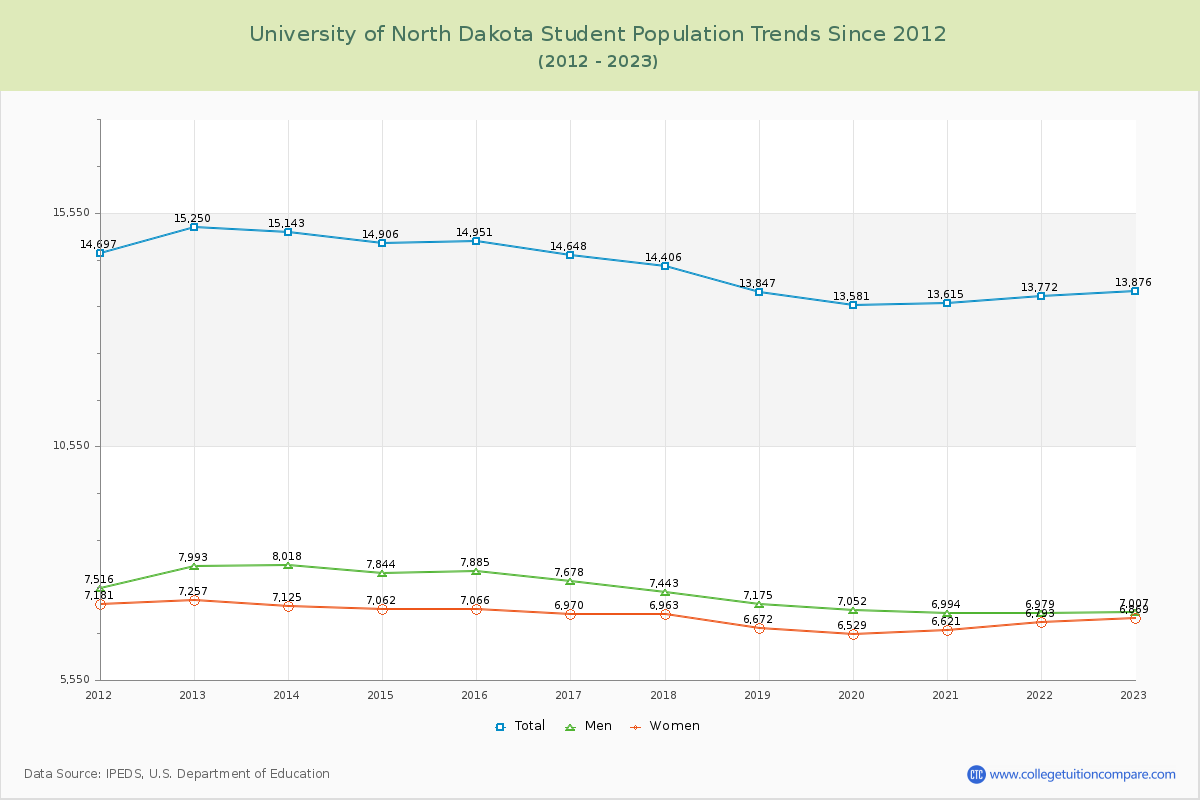
Student Population Changes
The average student population over the last 12 years is 14,363 where 13,876 students are attending the school for the academic year 2022-2023.
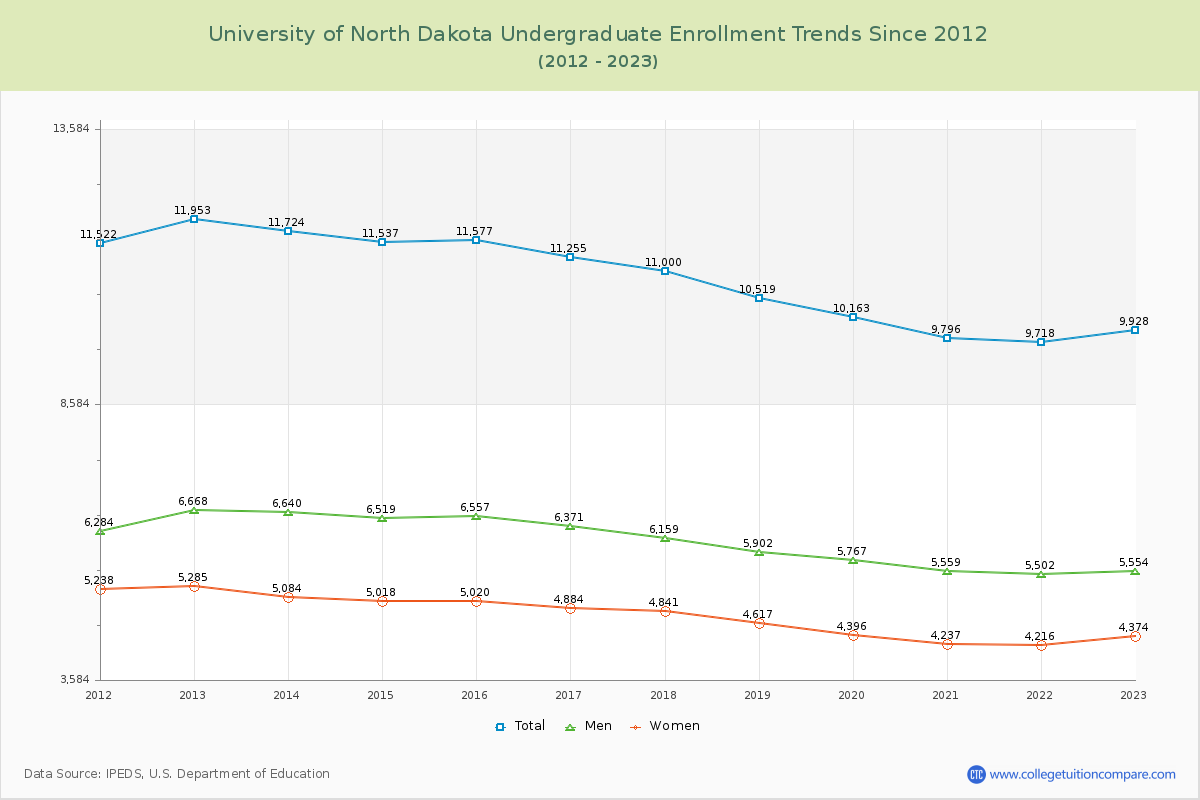
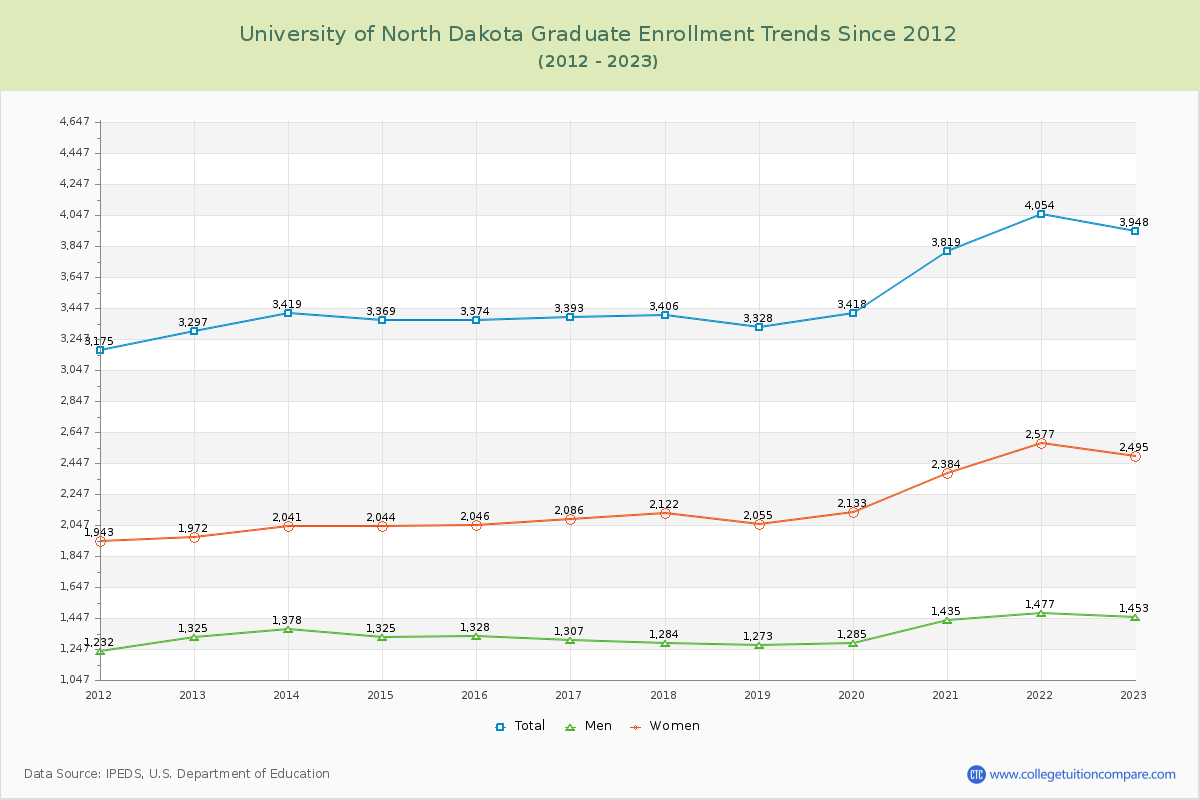
71.55% of total students is undergraduate students and 28.45% students is graduate students. The number of undergraduate students has decreased by 2,025 and the graduate enrollment has increased by 651 over past 10 years.
The female to male ratio is 0.98 to 1 and it means that there are similar numbers of female and male students enrolled in U of North Dakota.
The following table and chart illustrate the changes in student population by gender at University of North Dakota since 2012.
| Year | Total | Undergraduate | Graduate | ||||
|---|---|---|---|---|---|---|---|
| Total | Men | Women | Total | Men | Women | ||
| 2012-13 | 15,250 | 11,953 | 6,668 | 5,285 | 3,297 | 1,325 | 1,972 |
| 2013-14 | 15,143 -107 | 11,724 -229 | 6,640 -28 | 5,084 -201 | 3,419 122 | 1,378 53 | 2,041 69 |
| 2014-15 | 14,906 -237 | 11,537 -187 | 6,519 -121 | 5,018 -66 | 3,369 -50 | 1,325 -53 | 2,044 3 |
| 2015-16 | 14,951 45 | 11,577 40 | 6,557 38 | 5,020 2 | 3,374 5 | 1,328 3 | 2,046 2 |
| 2016-17 | 14,648 -303 | 11,255 -322 | 6,371 -186 | 4,884 -136 | 3,393 19 | 1,307 -21 | 2,086 40 |
| 2017-18 | 14,406 -242 | 11,000 -255 | 6,159 -212 | 4,841 -43 | 3,406 13 | 1,284 -23 | 2,122 36 |
| 2018-19 | 13,847 -559 | 10,519 -481 | 5,902 -257 | 4,617 -224 | 3,328 -78 | 1,273 -11 | 2,055 -67 |
| 2019-20 | 13,581 -266 | 10,163 -356 | 5,767 -135 | 4,396 -221 | 3,418 90 | 1,285 12 | 2,133 78 |
| 2020-21 | 13,615 34 | 9,796 -367 | 5,559 -208 | 4,237 -159 | 3,819 401 | 1,435 150 | 2,384 251 |
| 2021-22 | 13,772 157 | 9,718 -78 | 5,502 -57 | 4,216 -21 | 4,054 235 | 1,477 42 | 2,577 193 |
| 2022-23 | 13,876 104 | 9,928 210 | 5,554 52 | 4,374 158 | 3,948 -106 | 1,453 -24 | 2,495 -82 |
| Average | 14,363 | 10,834 | 6,109 | 4,725 | 3,530 | 1,352 | 2,178 |