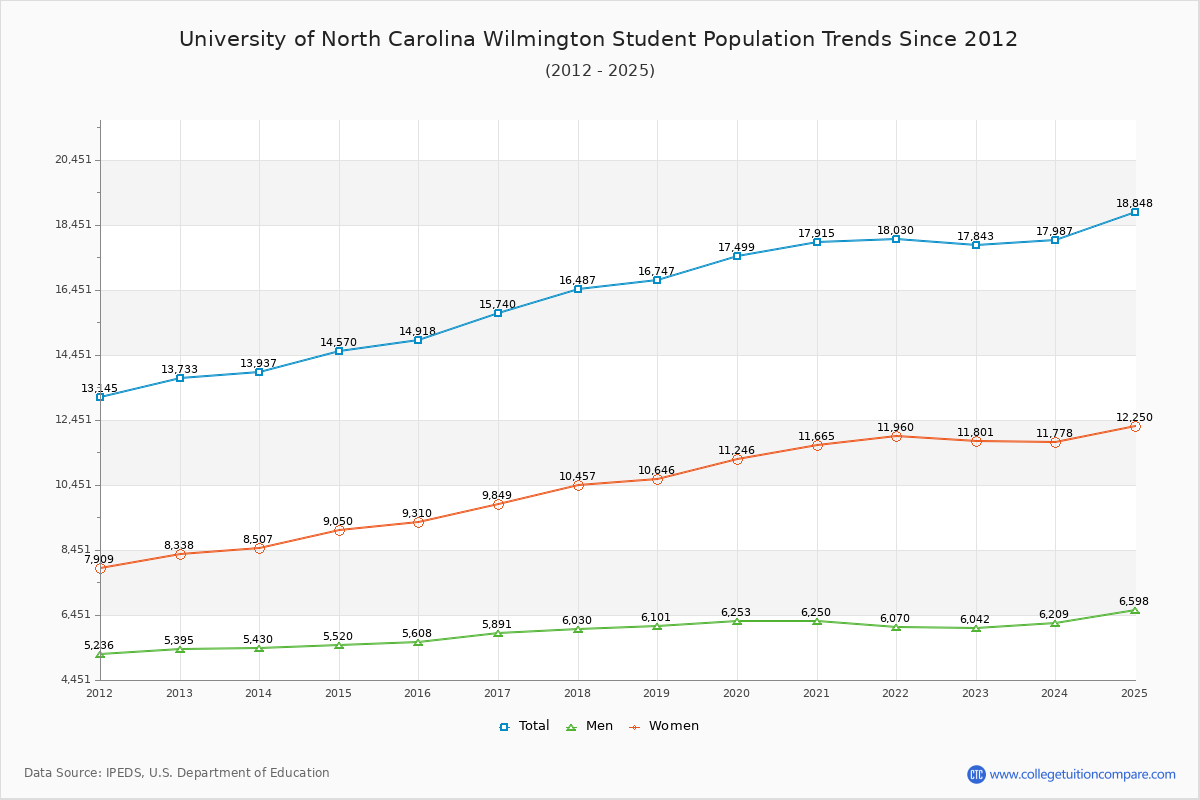
Student Population Changes
The average student population over the last 12 years is 16,129 where 17,843 students are attending the school for the academic year 2022-2023.
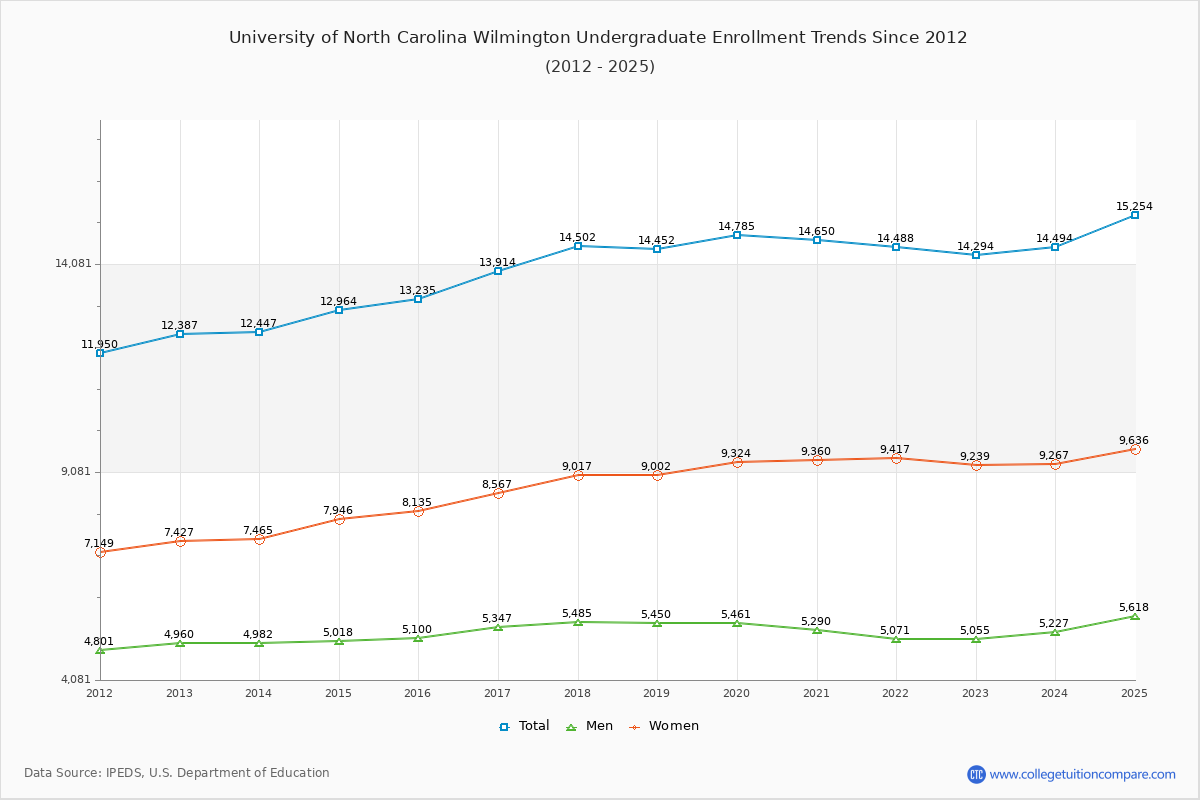
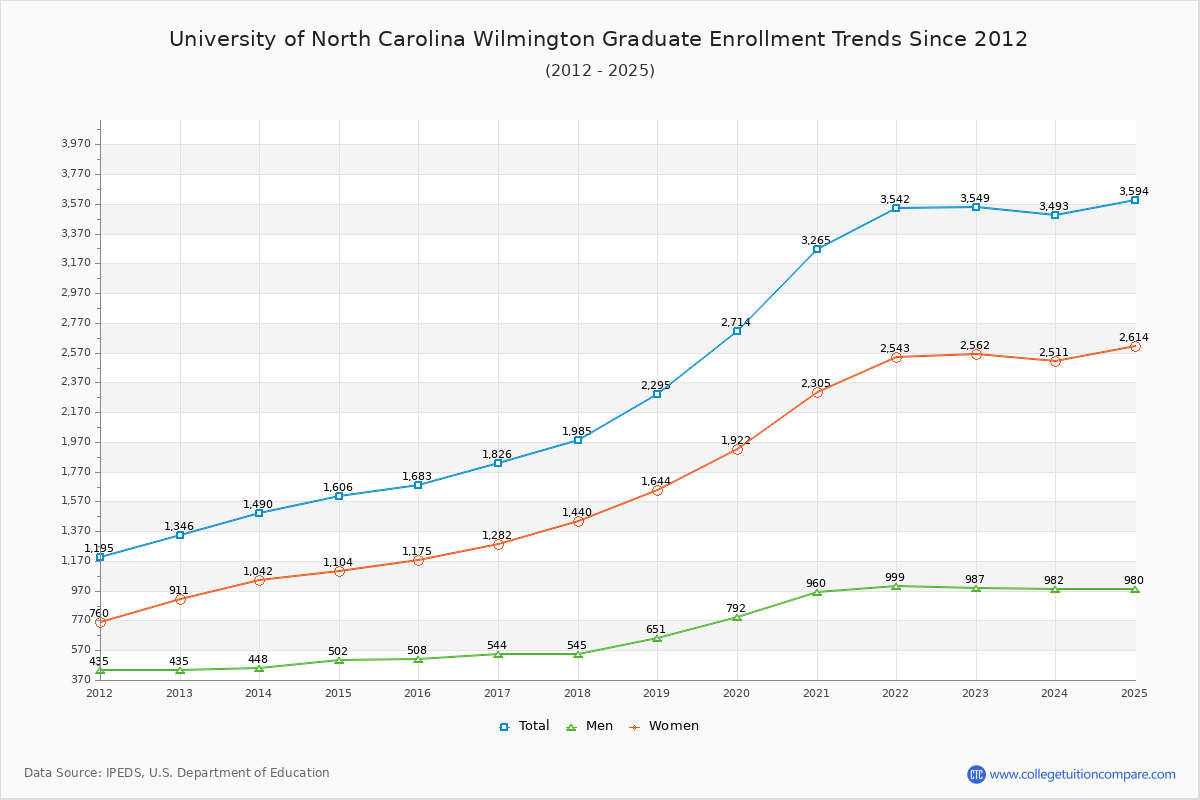
80.11% of total students is undergraduate students and 19.89% students is graduate students. The number of undergraduate students has increased by 1,907 and the graduate enrollment has increased by 2,203 over past 10 years.
The female to male ratio is 1.95 to 1 and it means that there are more female students enrolled in UNCW than male students.
The following table and chart illustrate the changes in student population by gender at University of North Carolina Wilmington since 2012.
| Year | Total | Undergraduate | Graduate | ||||
|---|---|---|---|---|---|---|---|
| Total | Men | Women | Total | Men | Women | ||
| 2012-13 | 13,733 | 12,387 | 4,960 | 7,427 | 1,346 | 435 | 911 |
| 2013-14 | 13,937 204 | 12,447 60 | 4,982 22 | 7,465 38 | 1,490 144 | 448 13 | 1,042 131 |
| 2014-15 | 14,570 633 | 12,964 517 | 5,018 36 | 7,946 481 | 1,606 116 | 502 54 | 1,104 62 |
| 2015-16 | 14,918 348 | 13,235 271 | 5,100 82 | 8,135 189 | 1,683 77 | 508 6 | 1,175 71 |
| 2016-17 | 15,740 822 | 13,914 679 | 5,347 247 | 8,567 432 | 1,826 143 | 544 36 | 1,282 107 |
| 2017-18 | 16,487 747 | 14,502 588 | 5,485 138 | 9,017 450 | 1,985 159 | 545 1 | 1,440 158 |
| 2018-19 | 16,747 260 | 14,452 -50 | 5,450 -35 | 9,002 -15 | 2,295 310 | 651 106 | 1,644 204 |
| 2019-20 | 17,499 752 | 14,785 333 | 5,461 11 | 9,324 322 | 2,714 419 | 792 141 | 1,922 278 |
| 2020-21 | 17,915 416 | 14,650 -135 | 5,290 -171 | 9,360 36 | 3,265 551 | 960 168 | 2,305 383 |
| 2021-22 | 18,030 115 | 14,488 -162 | 5,071 -219 | 9,417 57 | 3,542 277 | 999 39 | 2,543 238 |
| 2022-23 | 17,843 -187 | 14,294 -194 | 5,055 -16 | 9,239 -178 | 3,549 7 | 987 -12 | 2,562 19 |
| Average | 16,129 | 13,829 | 5,202 | 8,627 | 2,300 | 670 | 1,630 |