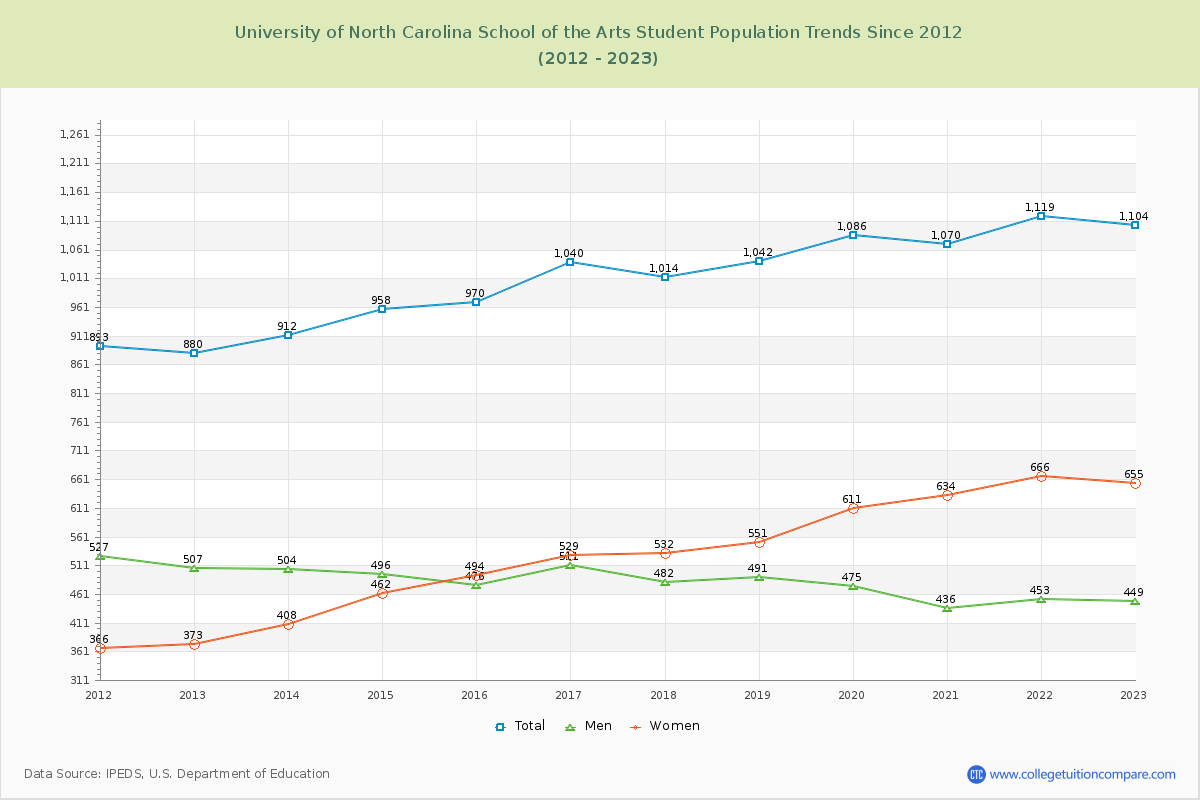
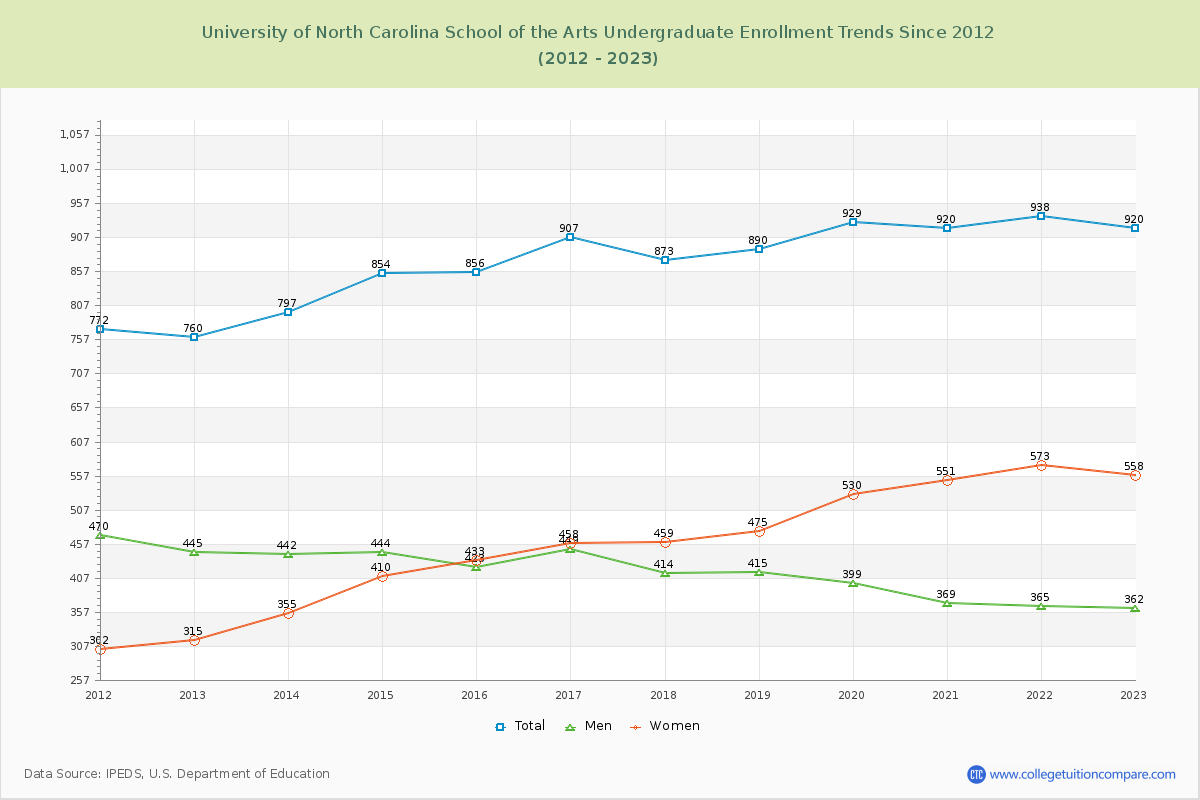
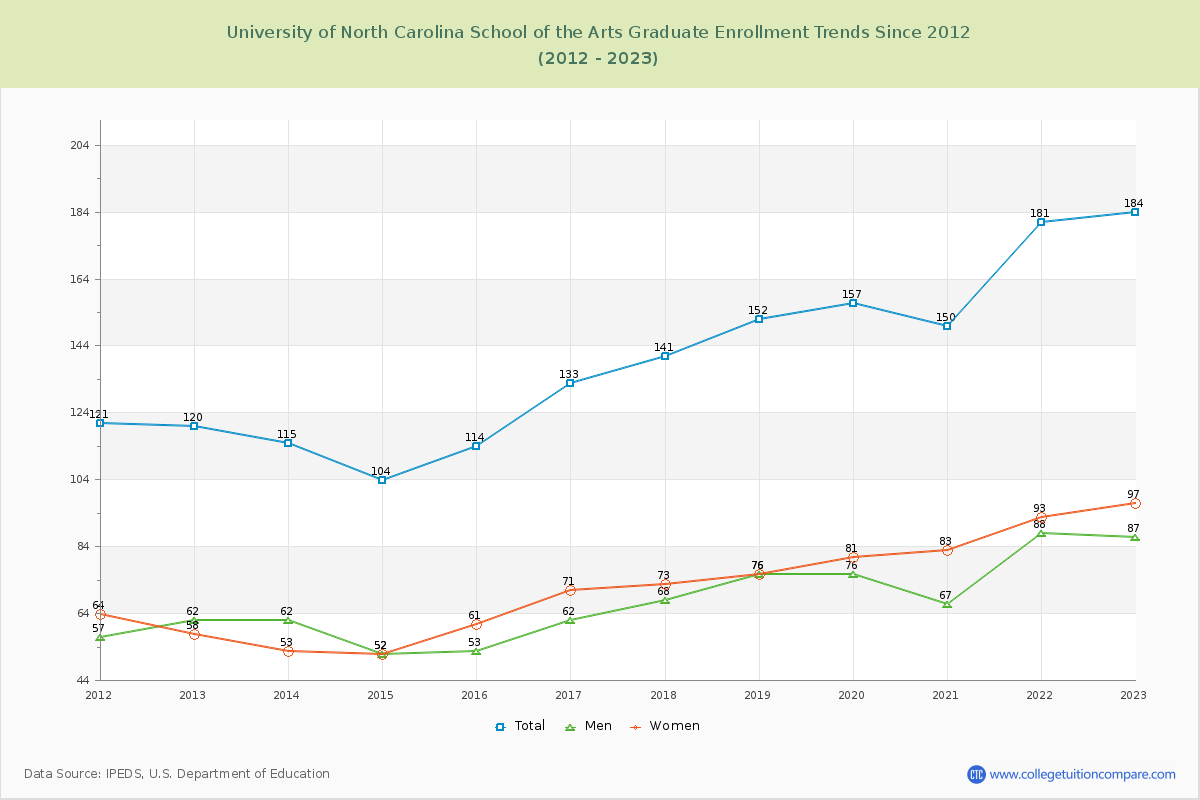
Student Population Changes
The average student population over the last 12 years is 1,018 where 1,104 students are attending the school for the academic year 2022-2023.
83.33% of total students is undergraduate students and 16.67% students is graduate students. The number of undergraduate students has increased by 160 and the graduate enrollment has increased by 64 over past 10 years.
The female to male ratio is 1.46 to 1 and it means that there are more female students enrolled in UNCSA than male students.
The following table and chart illustrate the changes in student population by gender at University of North Carolina School of the Arts since 2012.
| Year | Total | Undergraduate | Graduate | ||||
|---|---|---|---|---|---|---|---|
| Total | Men | Women | Total | Men | Women | ||
| 2012-13 | 880 | 760 | 445 | 315 | 120 | 62 | 58 |
| 2013-14 | 912 32 | 797 37 | 442 -3 | 355 40 | 115 -5 | 62 0 | 53 -5 |
| 2014-15 | 958 46 | 854 57 | 444 2 | 410 55 | 104 -11 | 52 -10 | 52 -1 |
| 2015-16 | 970 12 | 856 2 | 423 -21 | 433 23 | 114 10 | 53 1 | 61 9 |
| 2016-17 | 1,040 70 | 907 51 | 449 26 | 458 25 | 133 19 | 62 9 | 71 10 |
| 2017-18 | 1,014 -26 | 873 -34 | 414 -35 | 459 1 | 141 8 | 68 6 | 73 2 |
| 2018-19 | 1,042 28 | 890 17 | 415 1 | 475 16 | 152 11 | 76 8 | 76 3 |
| 2019-20 | 1,086 44 | 929 39 | 399 -16 | 530 55 | 157 5 | 76 0 | 81 5 |
| 2020-21 | 1,070 -16 | 920 -9 | 369 -30 | 551 21 | 150 -7 | 67 -9 | 83 2 |
| 2021-22 | 1,119 49 | 938 18 | 365 -4 | 573 22 | 181 31 | 88 21 | 93 10 |
| 2022-23 | 1,104 -15 | 920 -18 | 362 -3 | 558 -15 | 184 3 | 87 -1 | 97 4 |
| Average | 1,018 | 877 | 412 | 465 | 141 | 68 | 73 |