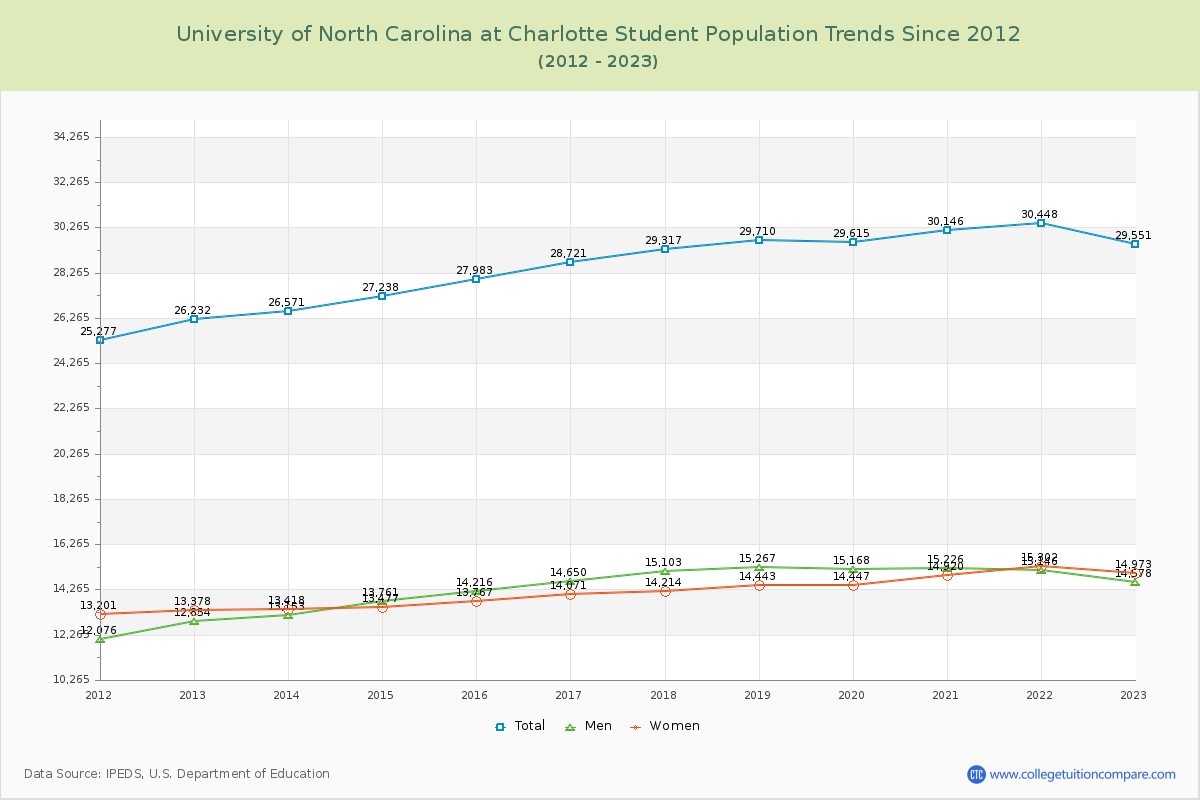
Student Population Changes
The average student population over the last 12 years is 28,685 where 29,551 students are attending the school for the academic year 2022-2023.
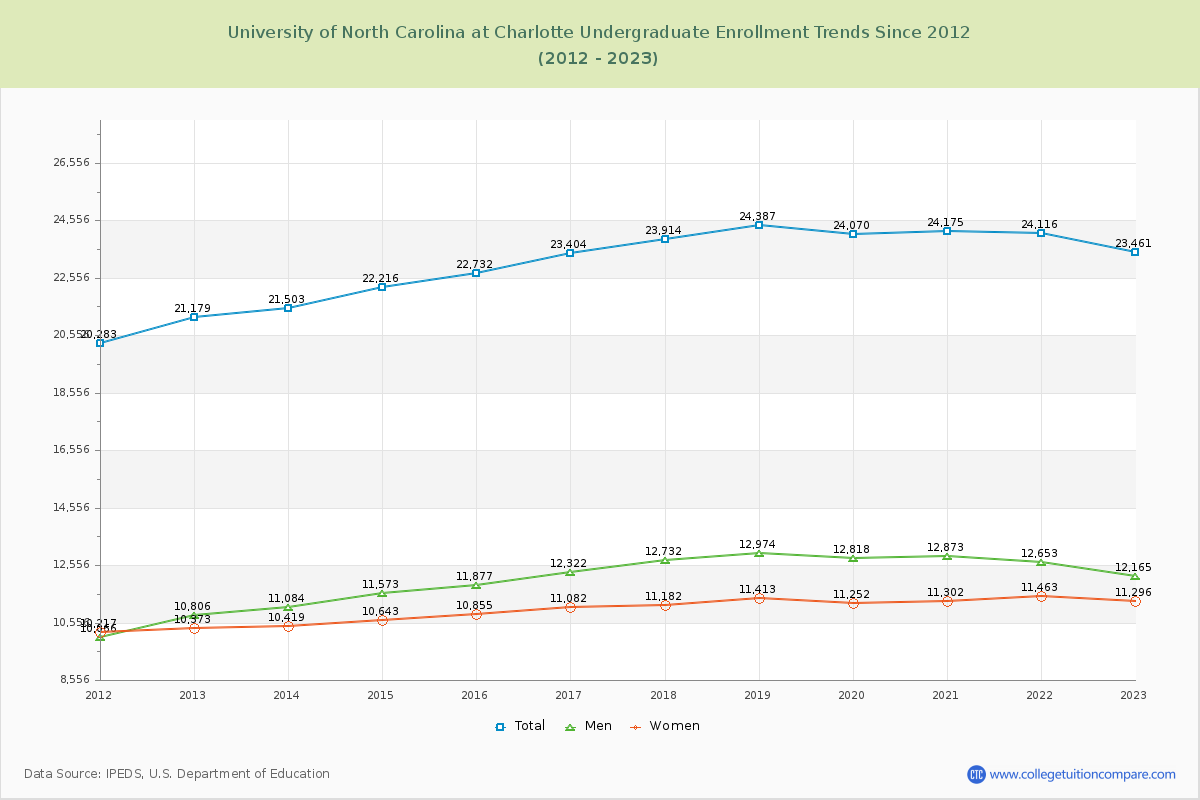
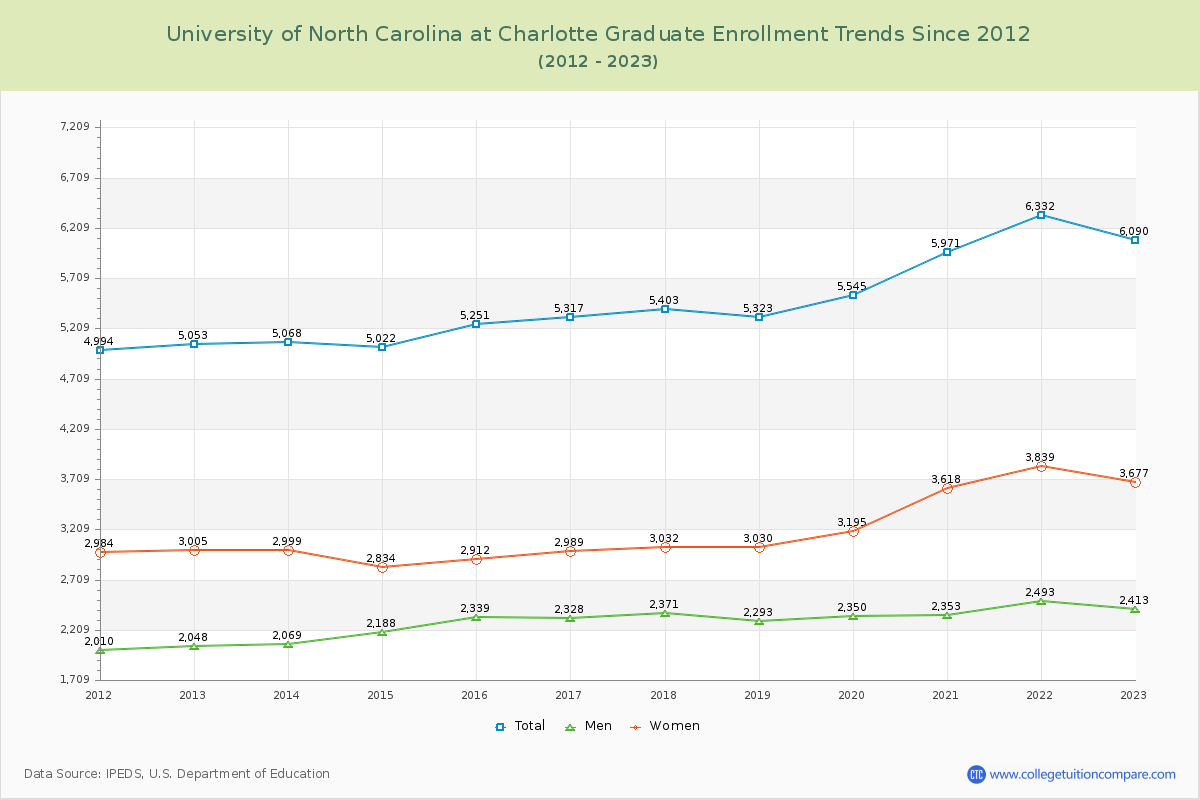
79.39% of total students is undergraduate students and 20.61% students is graduate students. The number of undergraduate students has increased by 2,282 and the graduate enrollment has increased by 1,037 over past 10 years.
The female to male ratio is 1.03 to 1 and it means that there are similar numbers of female and male students enrolled in UNC Charlotte.
The following table and chart illustrate the changes in student population by gender at University of North Carolina at Charlotte since 2012.
| Year | Total | Undergraduate | Graduate | ||||
|---|---|---|---|---|---|---|---|
| Total | Men | Women | Total | Men | Women | ||
| 2012-13 | 26,232 | 21,179 | 10,806 | 10,373 | 5,053 | 2,048 | 3,005 |
| 2013-14 | 26,571 339 | 21,503 324 | 11,084 278 | 10,419 46 | 5,068 15 | 2,069 21 | 2,999 -6 |
| 2014-15 | 27,238 667 | 22,216 713 | 11,573 489 | 10,643 224 | 5,022 -46 | 2,188 119 | 2,834 -165 |
| 2015-16 | 27,983 745 | 22,732 516 | 11,877 304 | 10,855 212 | 5,251 229 | 2,339 151 | 2,912 78 |
| 2016-17 | 28,721 738 | 23,404 672 | 12,322 445 | 11,082 227 | 5,317 66 | 2,328 -11 | 2,989 77 |
| 2017-18 | 29,317 596 | 23,914 510 | 12,732 410 | 11,182 100 | 5,403 86 | 2,371 43 | 3,032 43 |
| 2018-19 | 29,710 393 | 24,387 473 | 12,974 242 | 11,413 231 | 5,323 -80 | 2,293 -78 | 3,030 -2 |
| 2019-20 | 29,615 -95 | 24,070 -317 | 12,818 -156 | 11,252 -161 | 5,545 222 | 2,350 57 | 3,195 165 |
| 2020-21 | 30,146 531 | 24,175 105 | 12,873 55 | 11,302 50 | 5,971 426 | 2,353 3 | 3,618 423 |
| 2021-22 | 30,448 302 | 24,116 -59 | 12,653 -220 | 11,463 161 | 6,332 361 | 2,493 140 | 3,839 221 |
| 2022-23 | 29,551 -897 | 23,461 -655 | 12,165 -488 | 11,296 -167 | 6,090 -242 | 2,413 -80 | 3,677 -162 |
| Average | 28,685 | 23,196 | 12,171 | 11,025 | 5,489 | 2,295 | 3,194 |