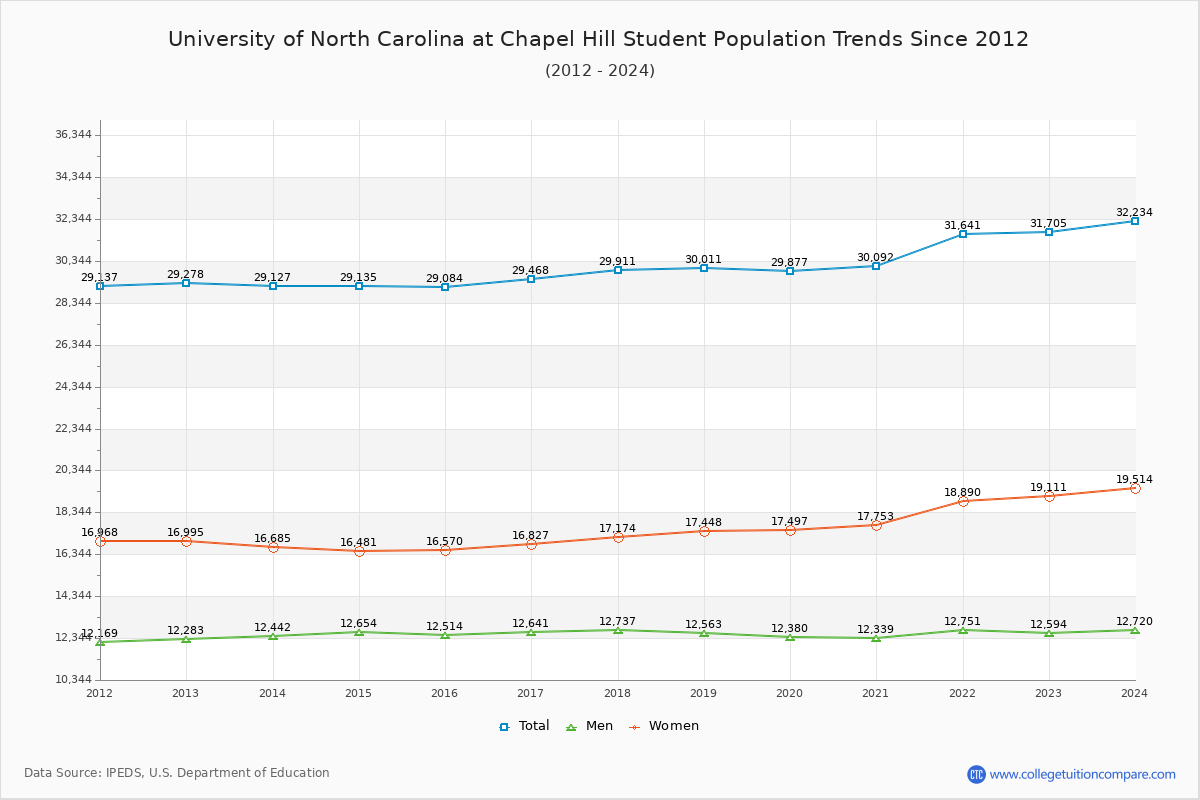
Student Population Changes
The average student population over the last 12 years is 29,939 where 31,705 students are attending the school for the academic year 2022-2023.
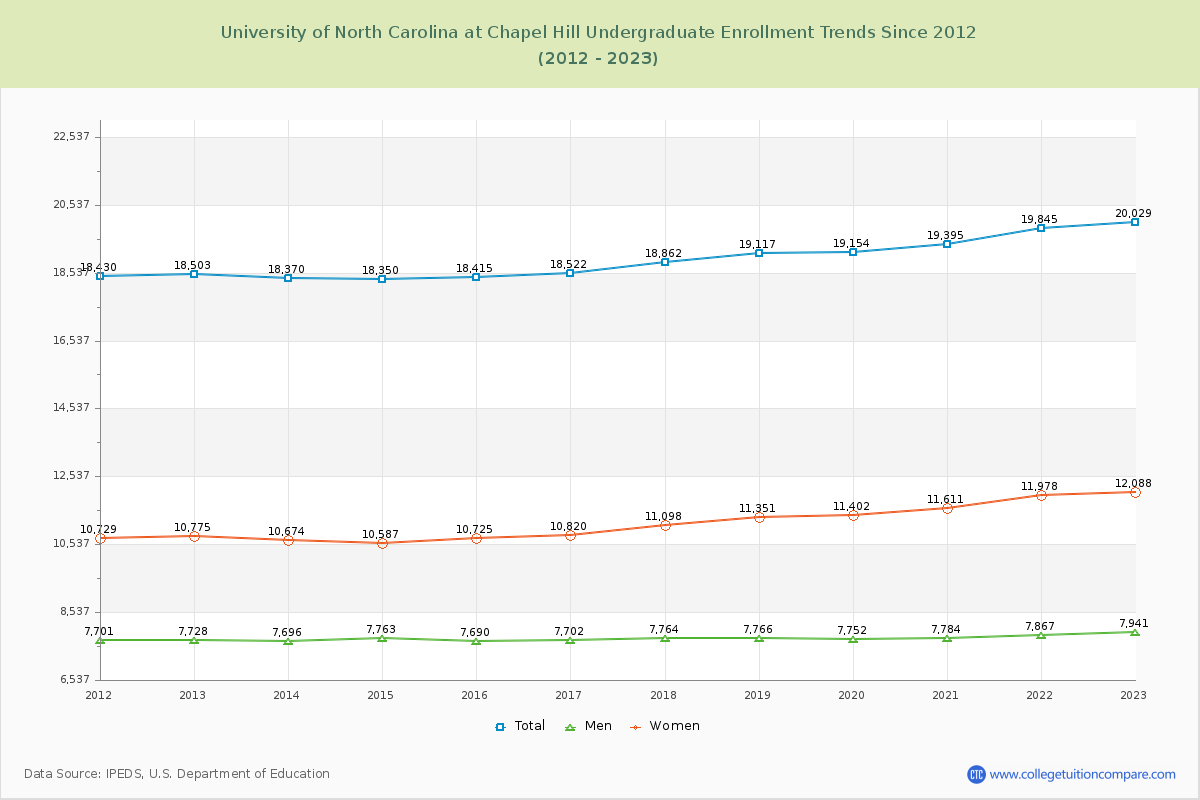
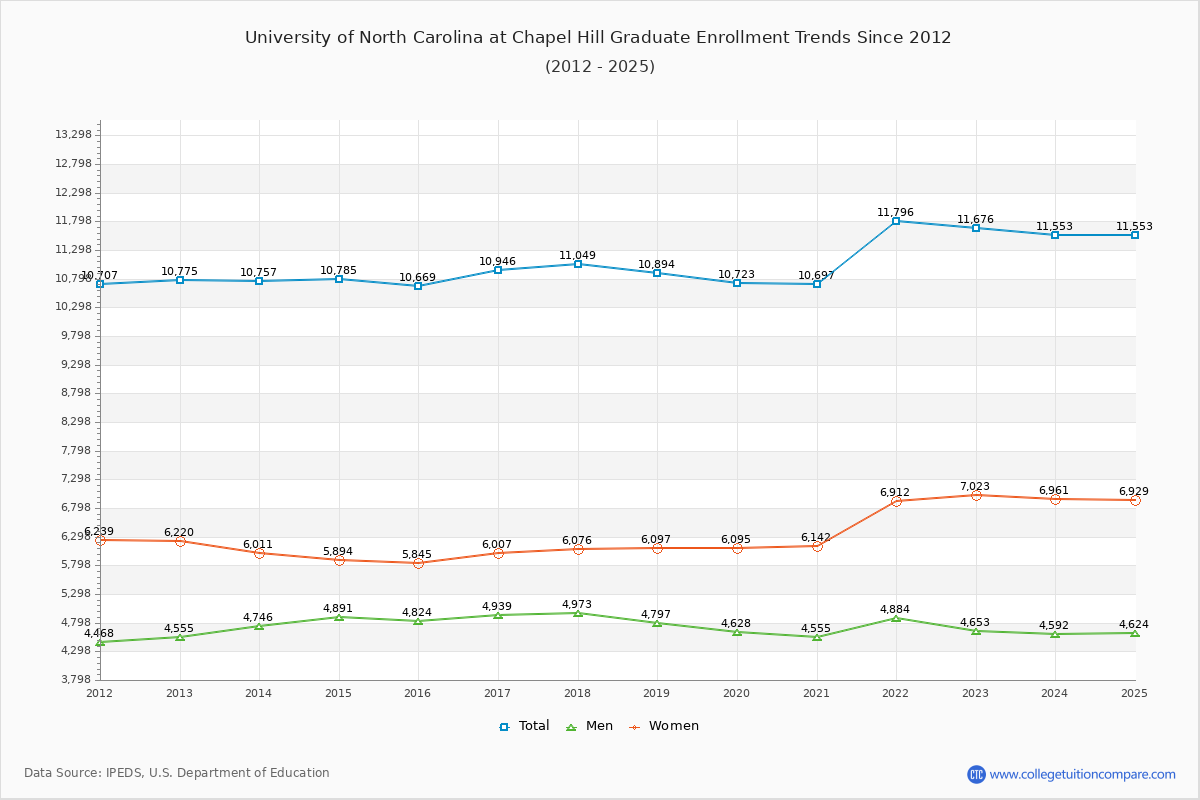
63.17% of total students is undergraduate students and 36.83% students is graduate students. The number of undergraduate students has increased by 1,526 and the graduate enrollment has increased by 901 over past 10 years.
The female to male ratio is 1.52 to 1 and it means that there are more female students enrolled in UNC than male students.
The following table and chart illustrate the changes in student population by gender at University of North Carolina at Chapel Hill since 2012.
| Year | Total | Undergraduate | Graduate | ||||
|---|---|---|---|---|---|---|---|
| Total | Men | Women | Total | Men | Women | ||
| 2012-13 | 29,278 | 18,503 | 7,728 | 10,775 | 10,775 | 4,555 | 6,220 |
| 2013-14 | 29,127 -151 | 18,370 -133 | 7,696 -32 | 10,674 -101 | 10,757 -18 | 4,746 191 | 6,011 -209 |
| 2014-15 | 29,135 8 | 18,350 -20 | 7,763 67 | 10,587 -87 | 10,785 28 | 4,891 145 | 5,894 -117 |
| 2015-16 | 29,084 -51 | 18,415 65 | 7,690 -73 | 10,725 138 | 10,669 -116 | 4,824 -67 | 5,845 -49 |
| 2016-17 | 29,468 384 | 18,522 107 | 7,702 12 | 10,820 95 | 10,946 277 | 4,939 115 | 6,007 162 |
| 2017-18 | 29,911 443 | 18,862 340 | 7,764 62 | 11,098 278 | 11,049 103 | 4,973 34 | 6,076 69 |
| 2018-19 | 30,011 100 | 19,117 255 | 7,766 2 | 11,351 253 | 10,894 -155 | 4,797 -176 | 6,097 21 |
| 2019-20 | 29,877 -134 | 19,154 37 | 7,752 -14 | 11,402 51 | 10,723 -171 | 4,628 -169 | 6,095 -2 |
| 2020-21 | 30,092 215 | 19,395 241 | 7,784 32 | 11,611 209 | 10,697 -26 | 4,555 -73 | 6,142 47 |
| 2021-22 | 31,641 1,549 | 19,845 450 | 7,867 83 | 11,978 367 | 11,796 1,099 | 4,884 329 | 6,912 770 |
| 2022-23 | 31,705 64 | 20,029 184 | 7,941 74 | 12,088 110 | 11,676 -120 | 4,653 -231 | 7,023 111 |
| Average | 29,939 | 18,960 | 7,768 | 11,192 | 10,979 | 4,768 | 6,211 |