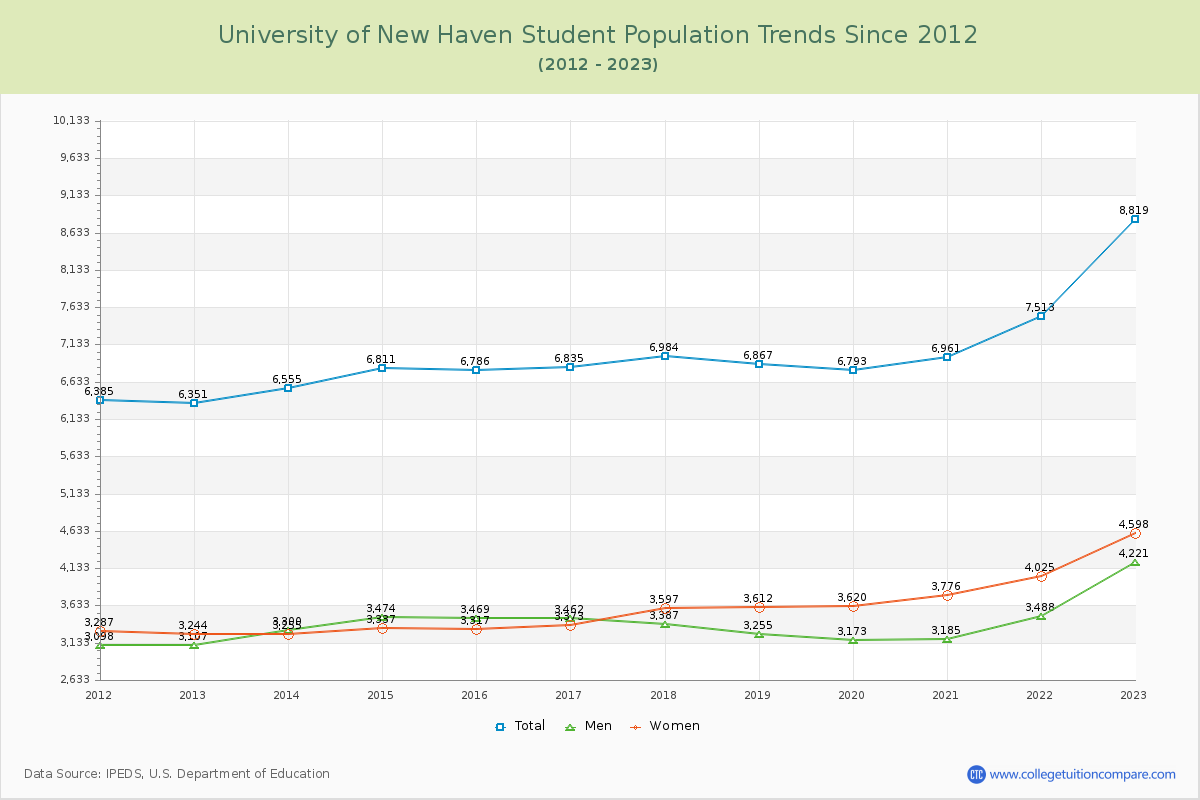
Student Population Changes
The average student population over the last 12 years is 7,025 where 8,819 students are attending the school for the academic year 2022-2023.
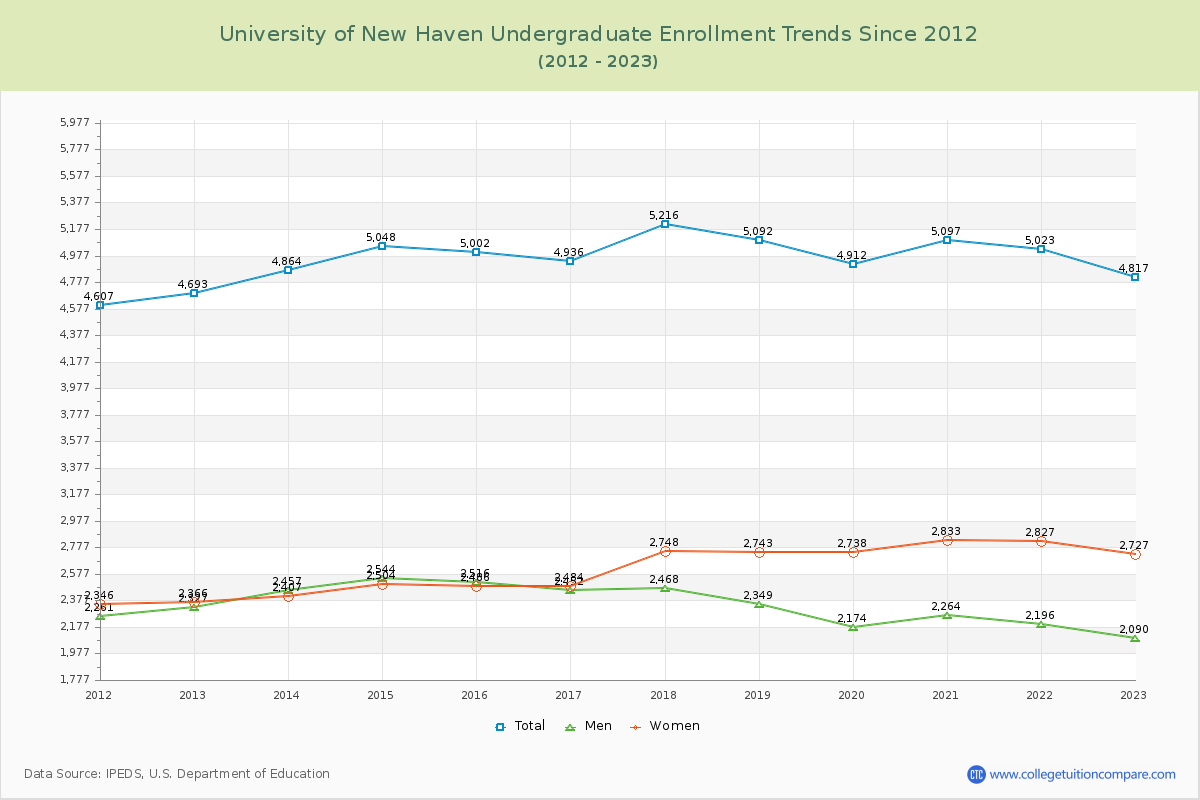
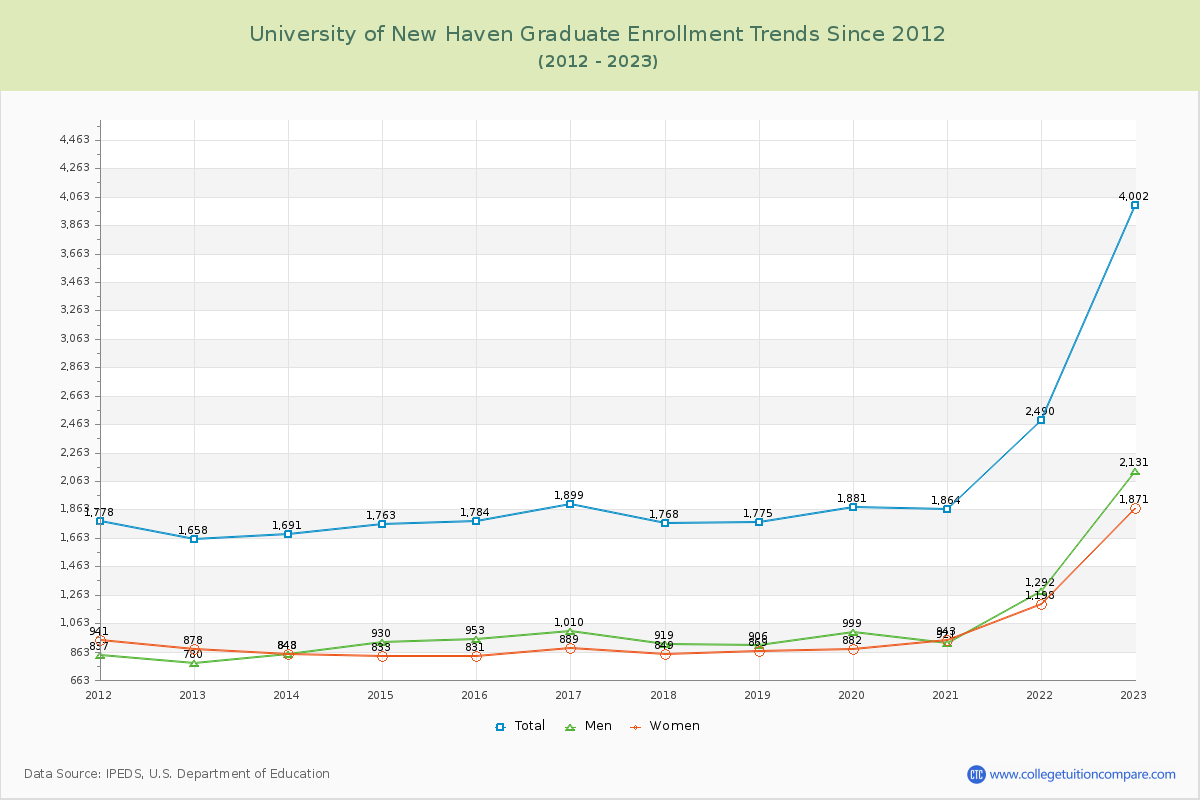
54.62% of total students is undergraduate students and 45.38% students is graduate students. The number of undergraduate students has increased by 124 and the graduate enrollment has increased by 2,344 over past 10 years.
The female to male ratio is 1.09 to 1 and it means that there are similar numbers of female and male students enrolled in UNH.
The following table and chart illustrate the changes in student population by gender at University of New Haven since 2012.
| Year | Total | Undergraduate | Graduate | ||||
|---|---|---|---|---|---|---|---|
| Total | Men | Women | Total | Men | Women | ||
| 2012-13 | 6,351 | 4,693 | 2,327 | 2,366 | 1,658 | 780 | 878 |
| 2013-14 | 6,555 204 | 4,864 171 | 2,457 130 | 2,407 41 | 1,691 33 | 843 63 | 848 -30 |
| 2014-15 | 6,811 256 | 5,048 184 | 2,544 87 | 2,504 97 | 1,763 72 | 930 87 | 833 -15 |
| 2015-16 | 6,786 -25 | 5,002 -46 | 2,516 -28 | 2,486 -18 | 1,784 21 | 953 23 | 831 -2 |
| 2016-17 | 6,835 49 | 4,936 -66 | 2,452 -64 | 2,484 -2 | 1,899 115 | 1,010 57 | 889 58 |
| 2017-18 | 6,984 149 | 5,216 280 | 2,468 16 | 2,748 264 | 1,768 -131 | 919 -91 | 849 -40 |
| 2018-19 | 6,867 -117 | 5,092 -124 | 2,349 -119 | 2,743 -5 | 1,775 7 | 906 -13 | 869 20 |
| 2019-20 | 6,793 -74 | 4,912 -180 | 2,174 -175 | 2,738 -5 | 1,881 106 | 999 93 | 882 13 |
| 2020-21 | 6,961 168 | 5,097 185 | 2,264 90 | 2,833 95 | 1,864 -17 | 921 -78 | 943 61 |
| 2021-22 | 7,513 552 | 5,023 -74 | 2,196 -68 | 2,827 -6 | 2,490 626 | 1,292 371 | 1,198 255 |
| 2022-23 | 8,819 1,306 | 4,817 -206 | 2,090 -106 | 2,727 -100 | 4,002 1,512 | 2,131 839 | 1,871 673 |
| Average | 7,025 | 4,973 | 2,349 | 2,624 | 2,052 | 1,062 | 990 |