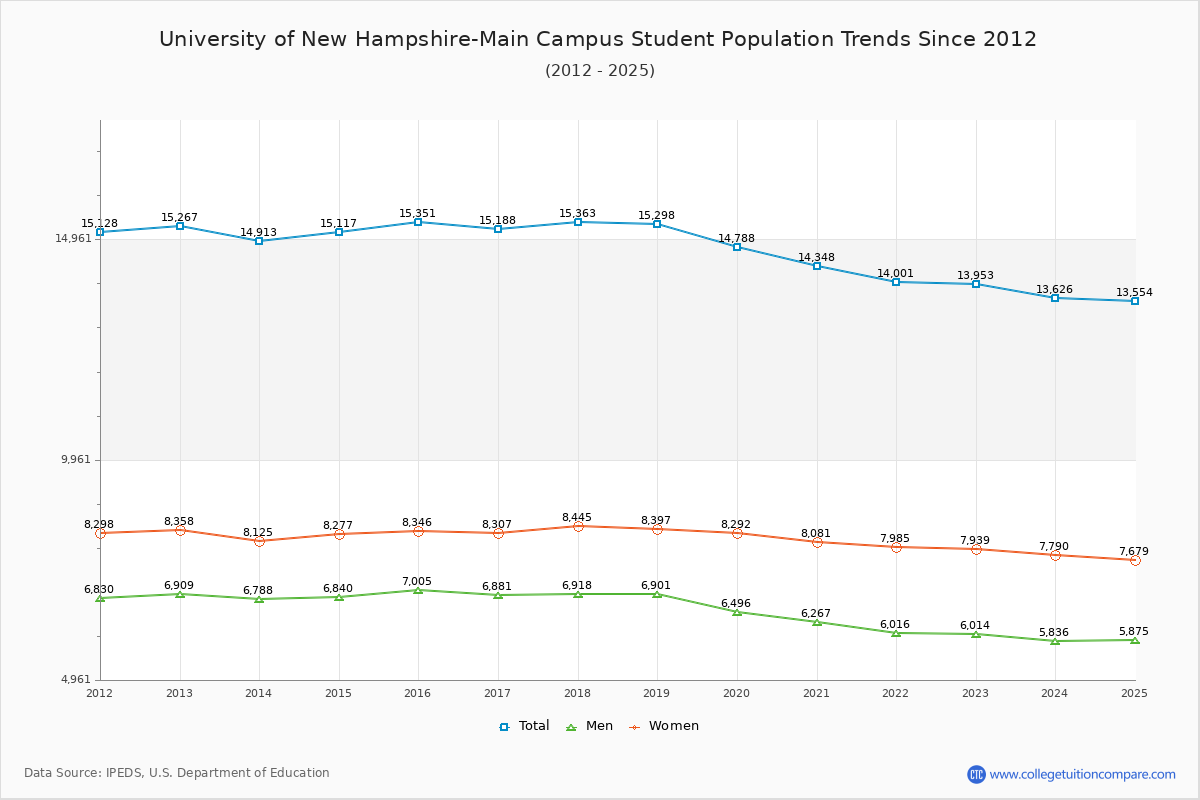
Student Population Changes
The average student population over the last 12 years is 14,872 where 13,953 students are attending the school for the academic year 2022-2023.
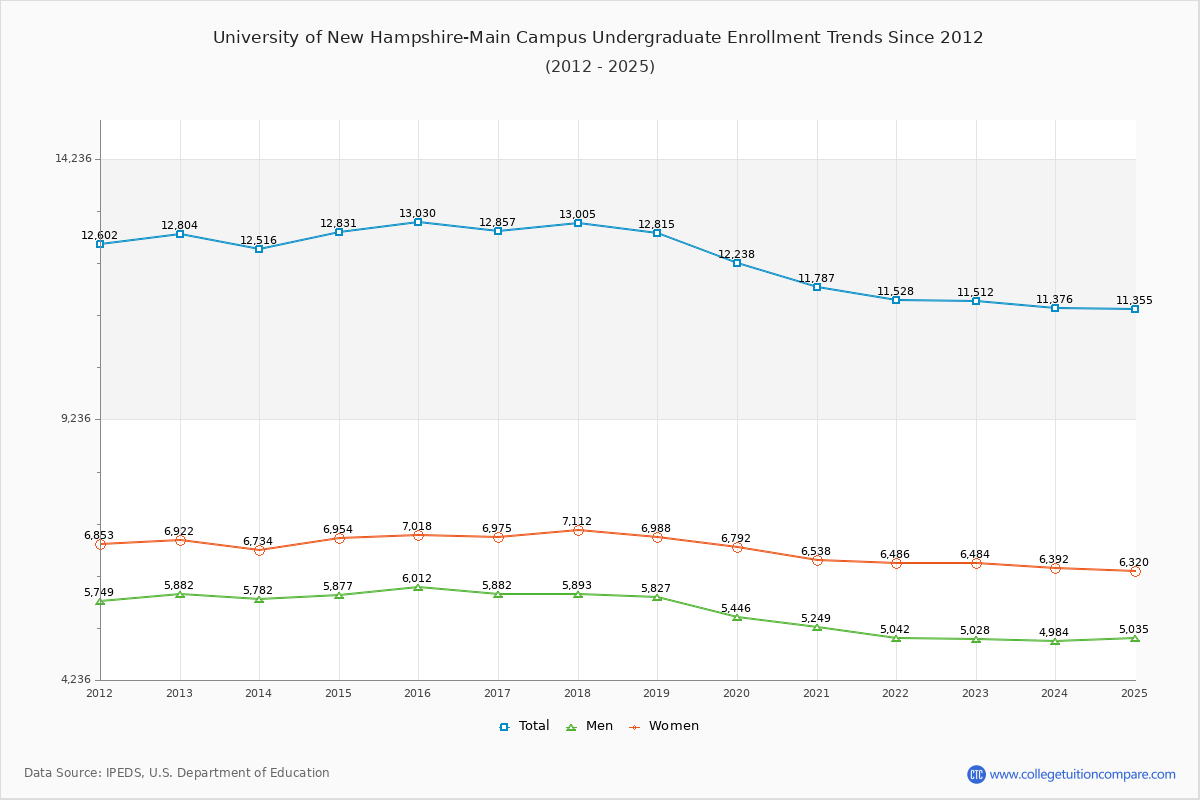
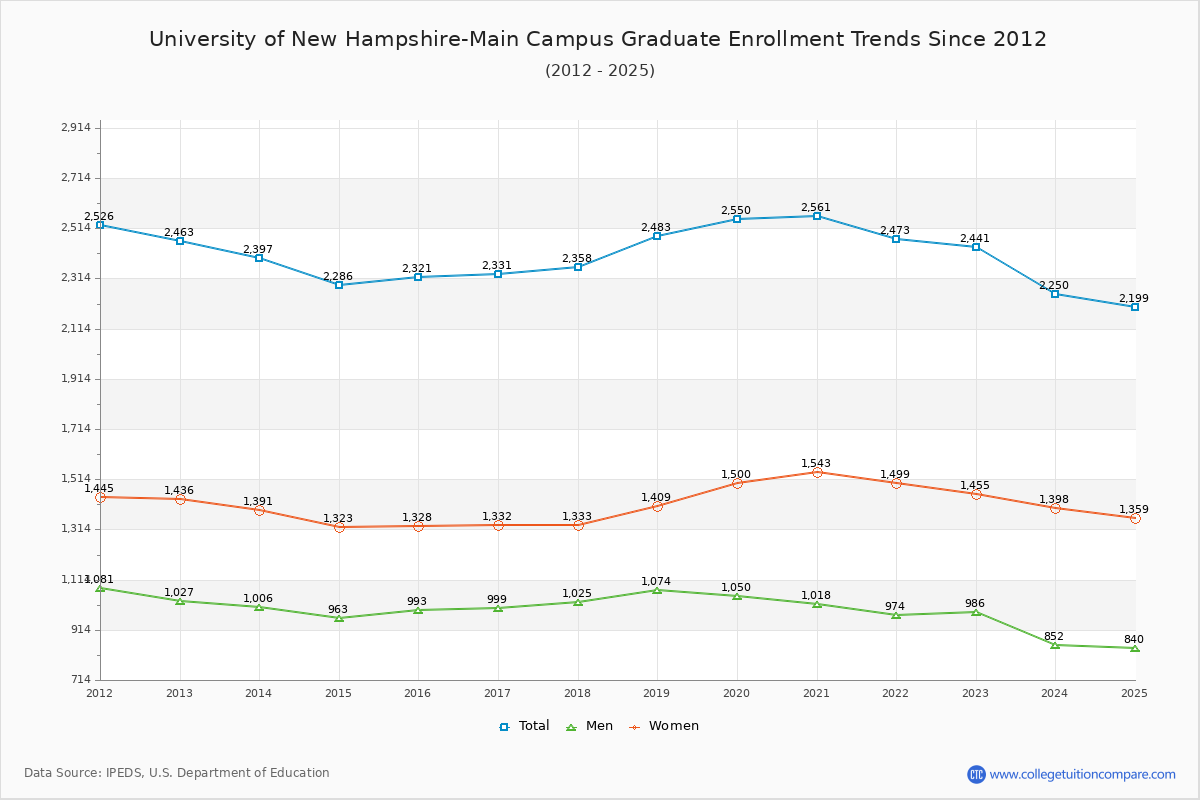
82.51% of total students is undergraduate students and 17.49% students is graduate students. The number of undergraduate students has decreased by 1,292 and the graduate enrollment has decreased by 22 over past 10 years.
The female to male ratio is 1.32 to 1 and it means that there are more female students enrolled in U of New Hampshire-Main Campus than male students.
The following table and chart illustrate the changes in student population by gender at University of New Hampshire-Main Campus since 2012.
| Year | Total | Undergraduate | Graduate | ||||
|---|---|---|---|---|---|---|---|
| Total | Men | Women | Total | Men | Women | ||
| 2012-13 | 15,267 | 12,804 | 5,882 | 6,922 | 2,463 | 1,027 | 1,436 |
| 2013-14 | 14,913 -354 | 12,516 -288 | 5,782 -100 | 6,734 -188 | 2,397 -66 | 1,006 -21 | 1,391 -45 |
| 2014-15 | 15,117 204 | 12,831 315 | 5,877 95 | 6,954 220 | 2,286 -111 | 963 -43 | 1,323 -68 |
| 2015-16 | 15,351 234 | 13,030 199 | 6,012 135 | 7,018 64 | 2,321 35 | 993 30 | 1,328 5 |
| 2016-17 | 15,188 -163 | 12,857 -173 | 5,882 -130 | 6,975 -43 | 2,331 10 | 999 6 | 1,332 4 |
| 2017-18 | 15,363 175 | 13,005 148 | 5,893 11 | 7,112 137 | 2,358 27 | 1,025 26 | 1,333 1 |
| 2018-19 | 15,298 -65 | 12,815 -190 | 5,827 -66 | 6,988 -124 | 2,483 125 | 1,074 49 | 1,409 76 |
| 2019-20 | 14,788 -510 | 12,238 -577 | 5,446 -381 | 6,792 -196 | 2,550 67 | 1,050 -24 | 1,500 91 |
| 2020-21 | 14,348 -440 | 11,787 -451 | 5,249 -197 | 6,538 -254 | 2,561 11 | 1,018 -32 | 1,543 43 |
| 2021-22 | 14,001 -347 | 11,528 -259 | 5,042 -207 | 6,486 -52 | 2,473 -88 | 974 -44 | 1,499 -44 |
| 2022-23 | 13,953 -48 | 11,512 -16 | 5,028 -14 | 6,484 -2 | 2,441 -32 | 986 12 | 1,455 -44 |
| Average | 14,872 | 12,448 | 5,629 | 6,818 | 2,424 | 1,010 | 1,414 |