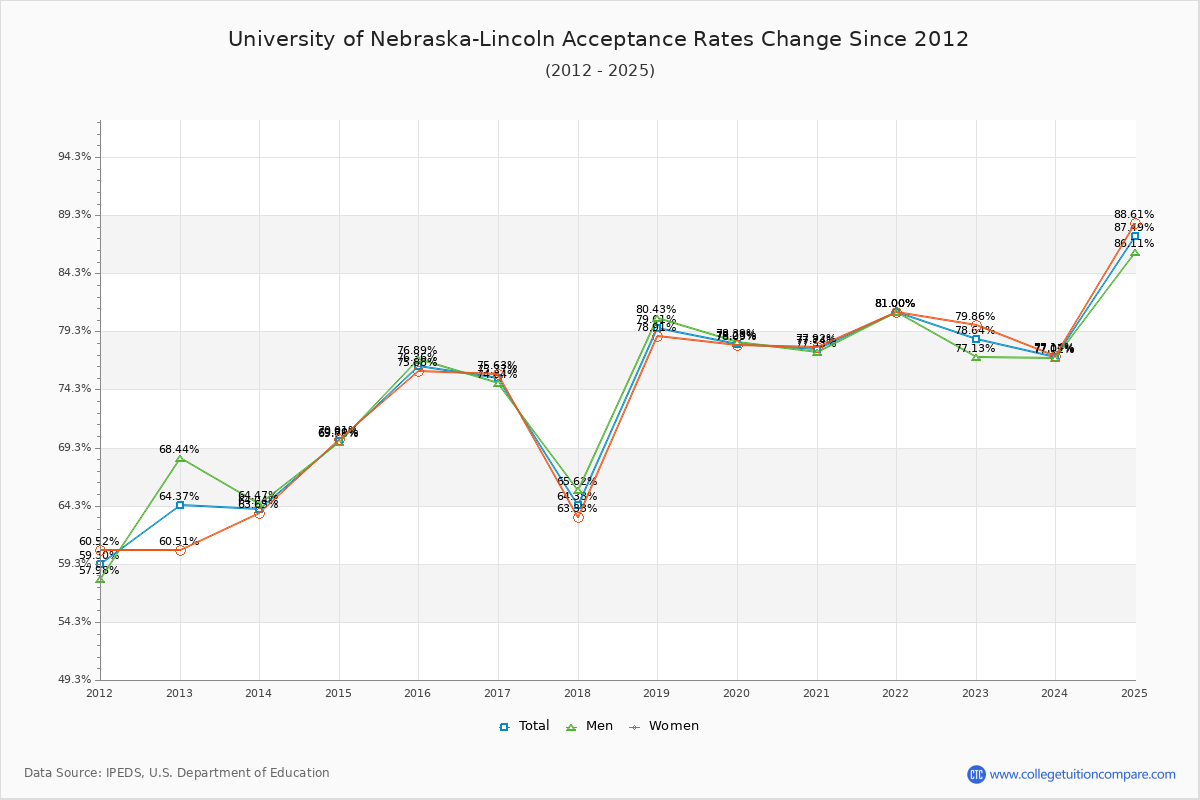
Acceptance Rate Changes
The average acceptance rate over the last 10 years is 73.59%, and this year's acceptance rate is 78.64% at University of Nebraska-Lincoln. By gender, men students' acceptance rate is 74.05% and women students' rate is 73.16%. For 2023 admission, it was slightly harder to get into University of Nebraska-Lincoln than the previous year.
The next table and chart illustrate the acceptance rates changes at University of Nebraska-Lincoln over the past 11 years (2012-2023).
| Year | Total | Men | Women |
|---|---|---|---|
| 2012-13 | 64.37% | 68.44% | 60.51% |
| 2013-14 | 64.04% -0.33% |
64.47% 3.14% |
63.65% 3.14% |
| 2014-15 | 69.89% 5.85% |
69.76% 6.36% |
70.01% 6.36% |
| 2015-16 | 76.36% 6.46% |
76.89% 5.87% |
75.88% 5.87% |
| 2016-17 | 75.27% -1.09% |
74.84% -0.26% |
75.63% -0.26% |
| 2017-18 | 64.38% -10.89% |
65.62% -12.29% |
63.33% -12.29% |
| 2018-19 | 79.61% 15.23% |
80.43% 15.58% |
78.91% 15.58% |
| 2019-20 | 78.23% -1.38% |
78.39% -0.82% |
78.09% -0.82% |
| 2020-21 | 77.74% -0.49% |
77.53% -0.17% |
77.92% -0.17% |
| 2021-22 | 81.00% 3.26% |
81.00% 3.08% |
81.00% 3.08% |
| 2022-23 | 78.64% -2.36% |
77.13% -1.14% |
79.86% -1.14% |
| Average | 73.59% | 74.05% | 73.16% |