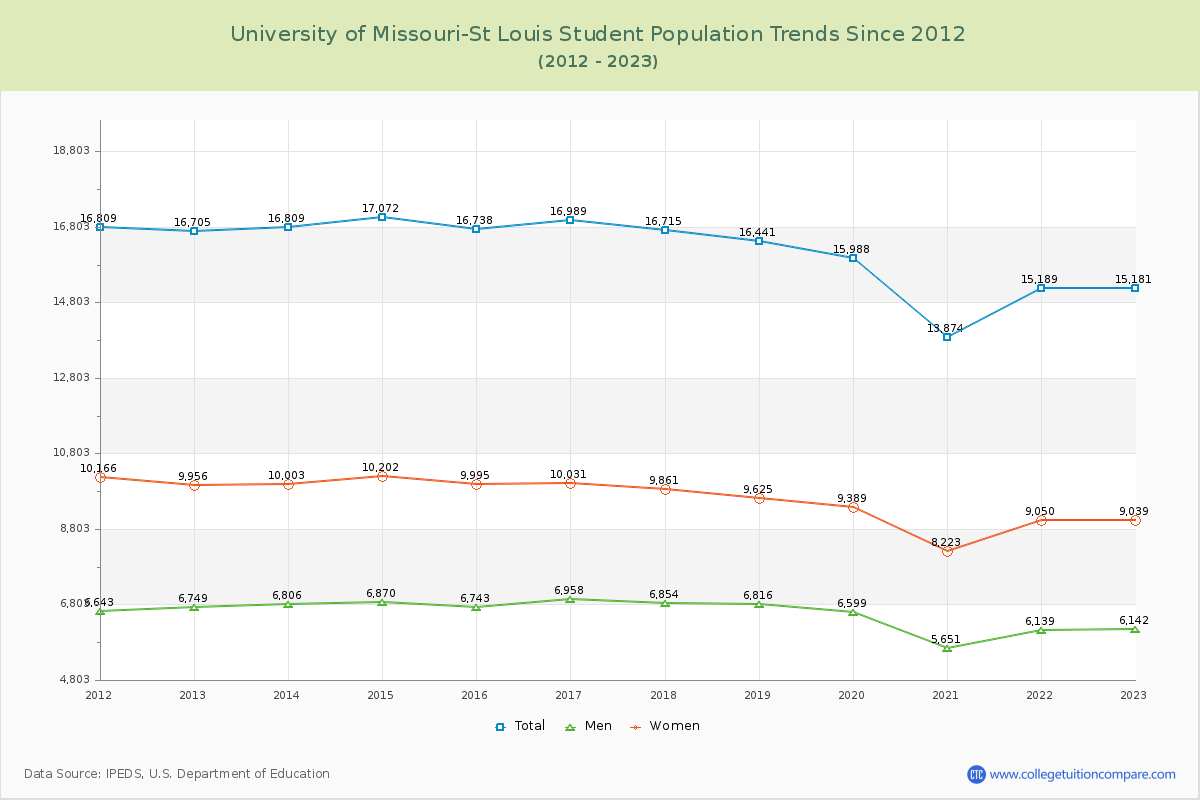
Student Population Changes
The average student population over the last 12 years is 16,155 where 15,181 students are attending the school for the academic year 2022-2023.
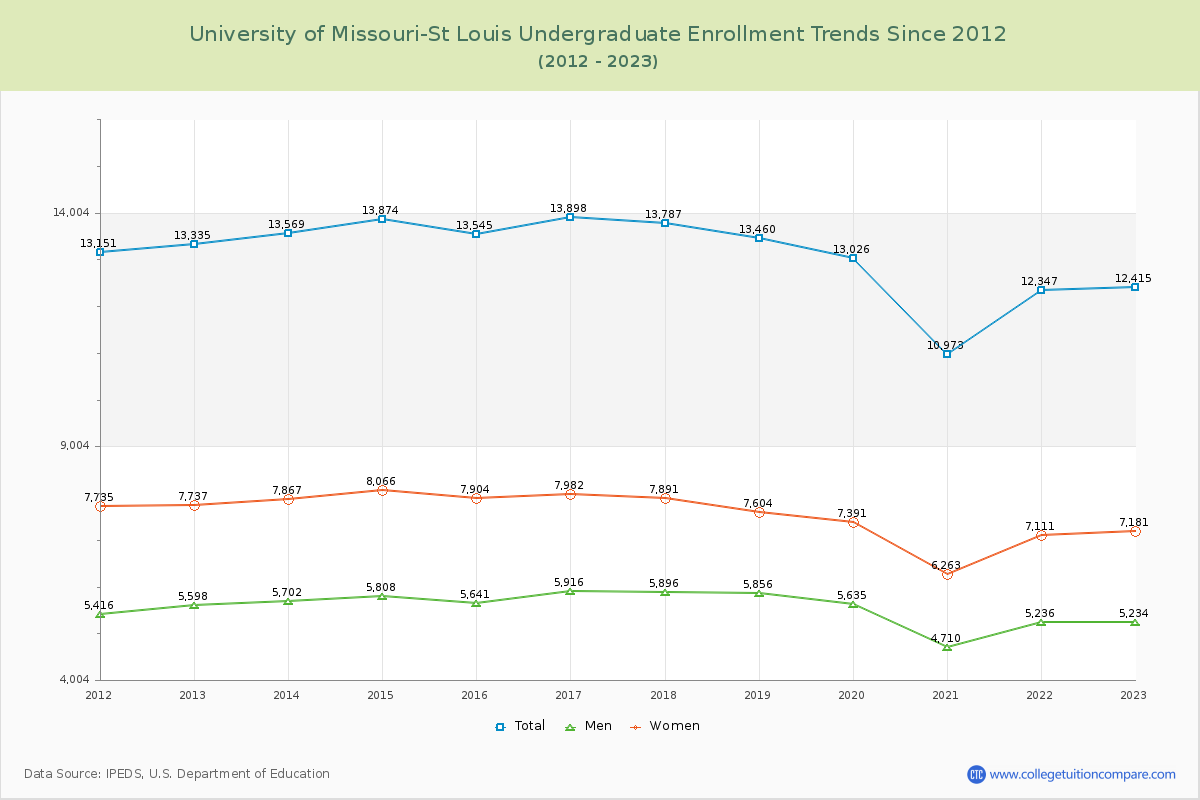
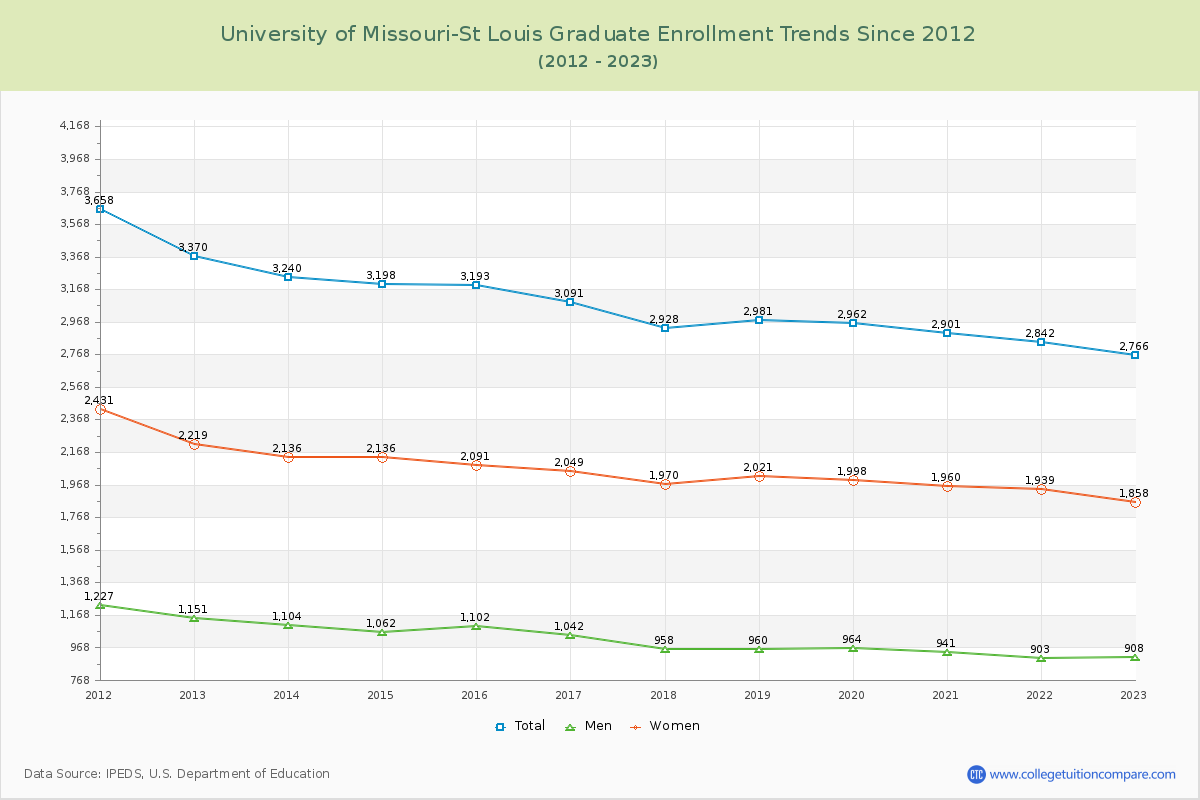
81.78% of total students is undergraduate students and 18.22% students is graduate students. The number of undergraduate students has decreased by 920 and the graduate enrollment has decreased by 604 over past 10 years.
The female to male ratio is 1.47 to 1 and it means that there are more female students enrolled in U of Missouri-St Louis than male students.
The following table and chart illustrate the changes in student population by gender at University of Missouri-St Louis since 2012.
| Year | Total | Undergraduate | Graduate | ||||
|---|---|---|---|---|---|---|---|
| Total | Men | Women | Total | Men | Women | ||
| 2012-13 | 16,705 | 13,335 | 5,598 | 7,737 | 3,370 | 1,151 | 2,219 |
| 2013-14 | 16,809 104 | 13,569 234 | 5,702 104 | 7,867 130 | 3,240 -130 | 1,104 -47 | 2,136 -83 |
| 2014-15 | 17,072 263 | 13,874 305 | 5,808 106 | 8,066 199 | 3,198 -42 | 1,062 -42 | 2,136 0 |
| 2015-16 | 16,738 -334 | 13,545 -329 | 5,641 -167 | 7,904 -162 | 3,193 -5 | 1,102 40 | 2,091 -45 |
| 2016-17 | 16,989 251 | 13,898 353 | 5,916 275 | 7,982 78 | 3,091 -102 | 1,042 -60 | 2,049 -42 |
| 2017-18 | 16,715 -274 | 13,787 -111 | 5,896 -20 | 7,891 -91 | 2,928 -163 | 958 -84 | 1,970 -79 |
| 2018-19 | 16,441 -274 | 13,460 -327 | 5,856 -40 | 7,604 -287 | 2,981 53 | 960 2 | 2,021 51 |
| 2019-20 | 15,988 -453 | 13,026 -434 | 5,635 -221 | 7,391 -213 | 2,962 -19 | 964 4 | 1,998 -23 |
| 2020-21 | 13,874 -2,114 | 10,973 -2,053 | 4,710 -925 | 6,263 -1,128 | 2,901 -61 | 941 -23 | 1,960 -38 |
| 2021-22 | 15,189 1,315 | 12,347 1,374 | 5,236 526 | 7,111 848 | 2,842 -59 | 903 -38 | 1,939 -21 |
| 2022-23 | 15,181 -8 | 12,415 68 | 5,234 -2 | 7,181 70 | 2,766 -76 | 908 5 | 1,858 -81 |
| Average | 16,155 | 13,112 | 5,567 | 7,545 | 3,043 | 1,009 | 2,034 |