SAT Scores Over Time
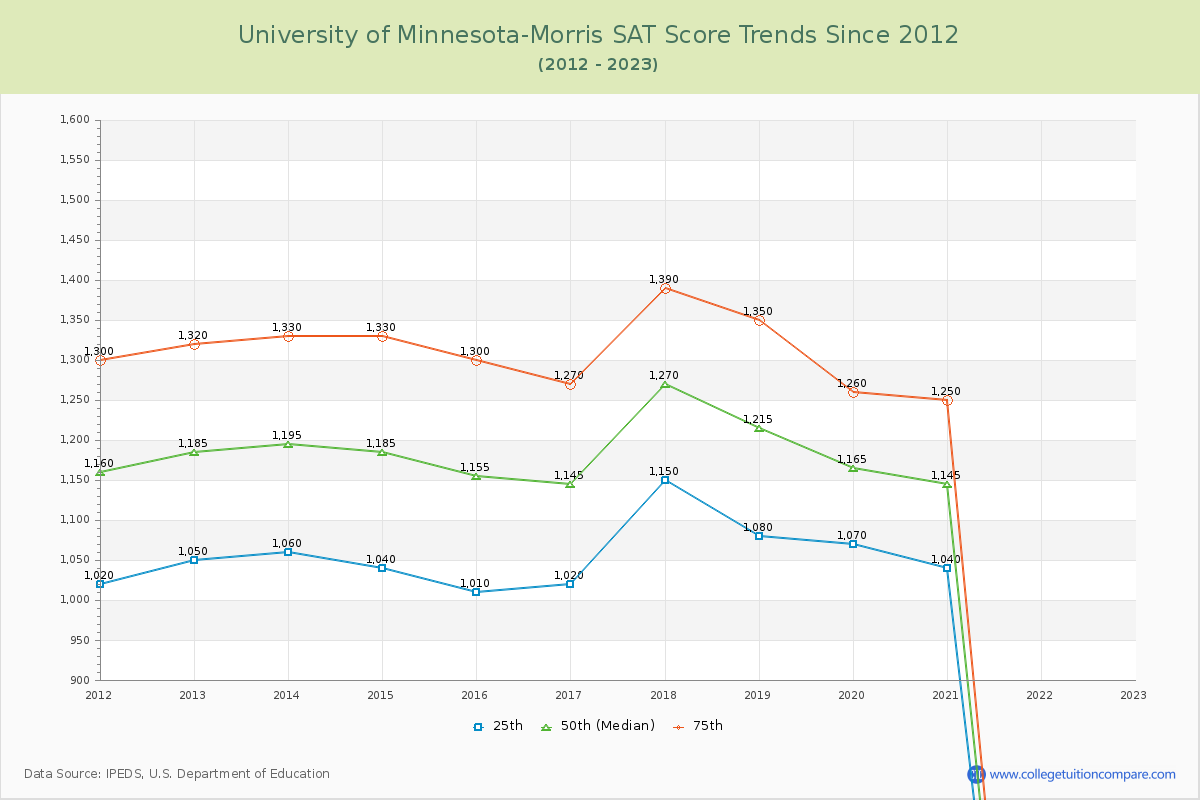
The 2023 SAT score is at U of Minnesota-Morris. Over the past 12 years, the average SAT score is 1058 (25th percentile) and 1311 (75th percentile). Compared to similar schools, the submitted SAT scores are around national average at U of Minnesota-Morris.
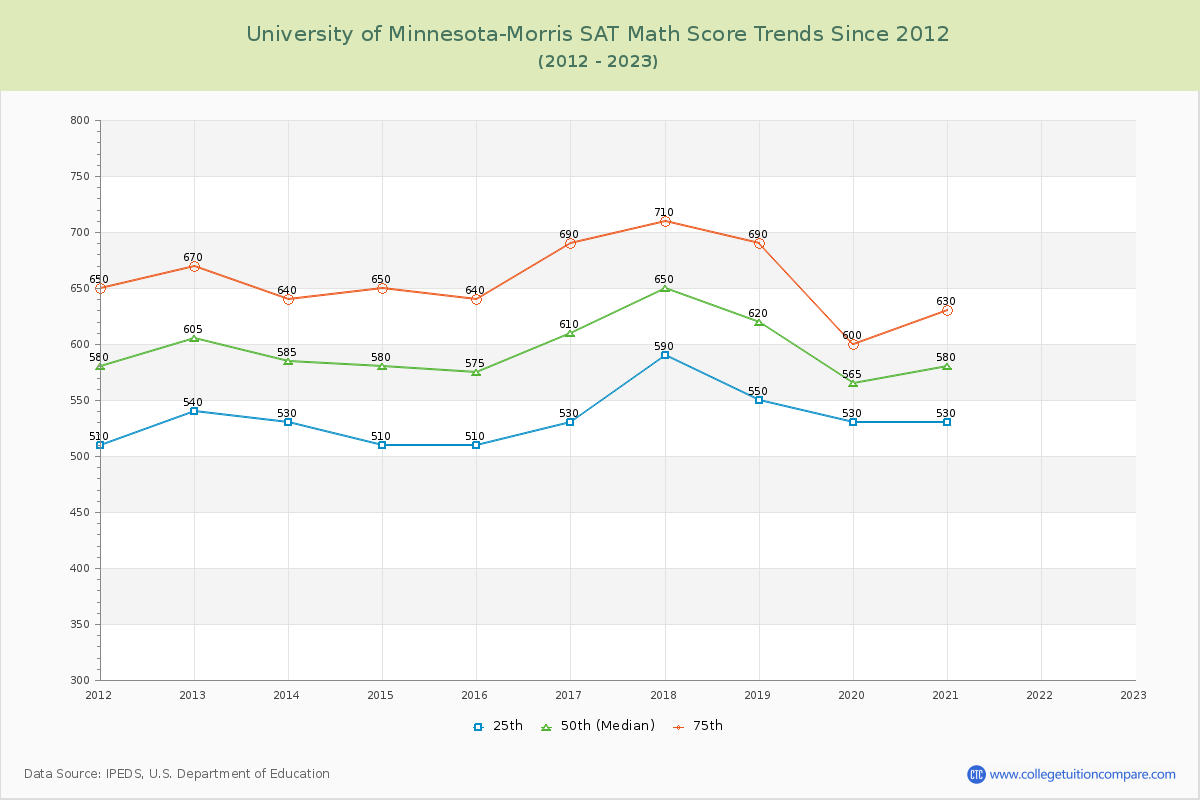
The following table and chart illustrate the changes in SAT scores at University of Minnesota-Morris since 2012.
| Year | Total | Math | Evidence-Based Reading and Writing | ||||||
|---|---|---|---|---|---|---|---|---|---|
| 25th | 50th | 75th | 25th | 50th | 75th | 25th | 50th | 75th | |
| 2012-13 | 1,050 | 1,185 | 1,320 | 540 | 605 | 670 | 510 | 580 | 650 |
| 2013-14 | 1,060 | 1,195 | 1,330 | 530 | 585 | 640 | 530 | 610 | 690 |
| 2014-15 | 1,040 | 1,185 | 1,330 | 510 | 580 | 650 | 530 | 605 | 680 |
| 2015-16 | 1,010 | 1,155 | 1,300 | 510 | 575 | 640 | 500 | 580 | 660 |
| 2016-17 | 1,020 | 1,145 | 1,270 | 530 | 610 | 690 | 490 | 535 | 580 |
| 2017-18 | 1,150 | 1,270 | 1,390 | 590 | 650 | 710 | 560 | 620 | 680 |
| 2018-19 | 1,080 | 1,215 | 1,350 | 550 | 620 | 690 | 530 | 595 | 660 |
| 2019-20 | 1,070 | 1,165 | 1,260 | 530 | 565 | 600 | 540 | 600 | 660 |
| 2020-21 | 1,040 | 1,145 | 1,250 | 530 | 580 | 630 | 510 | 565 | 620 |
| 2021-22 | - | - | - | - | - | - | - | - | - |
| 2022-23 | - | - | - | - | - | - | - | - | - |
| Average | 1058 | 1184 | 1311 | 536 | 597 | 658 | 522 | 588 | 653 |
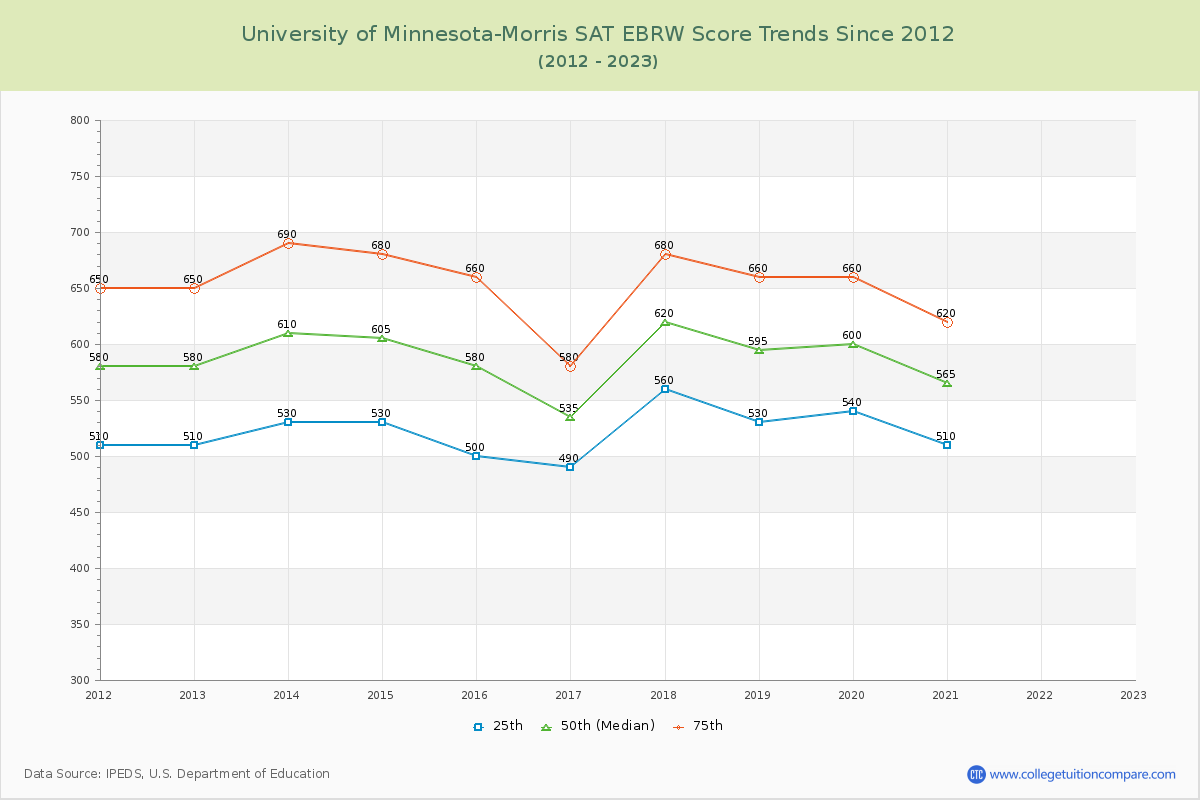
*SAT Evidence-Based Reading and Writing replaces SAT critical reading and writing since year 2017.
**The SAT Writing score is excluded from the total scores for year from 2011 to 2016.