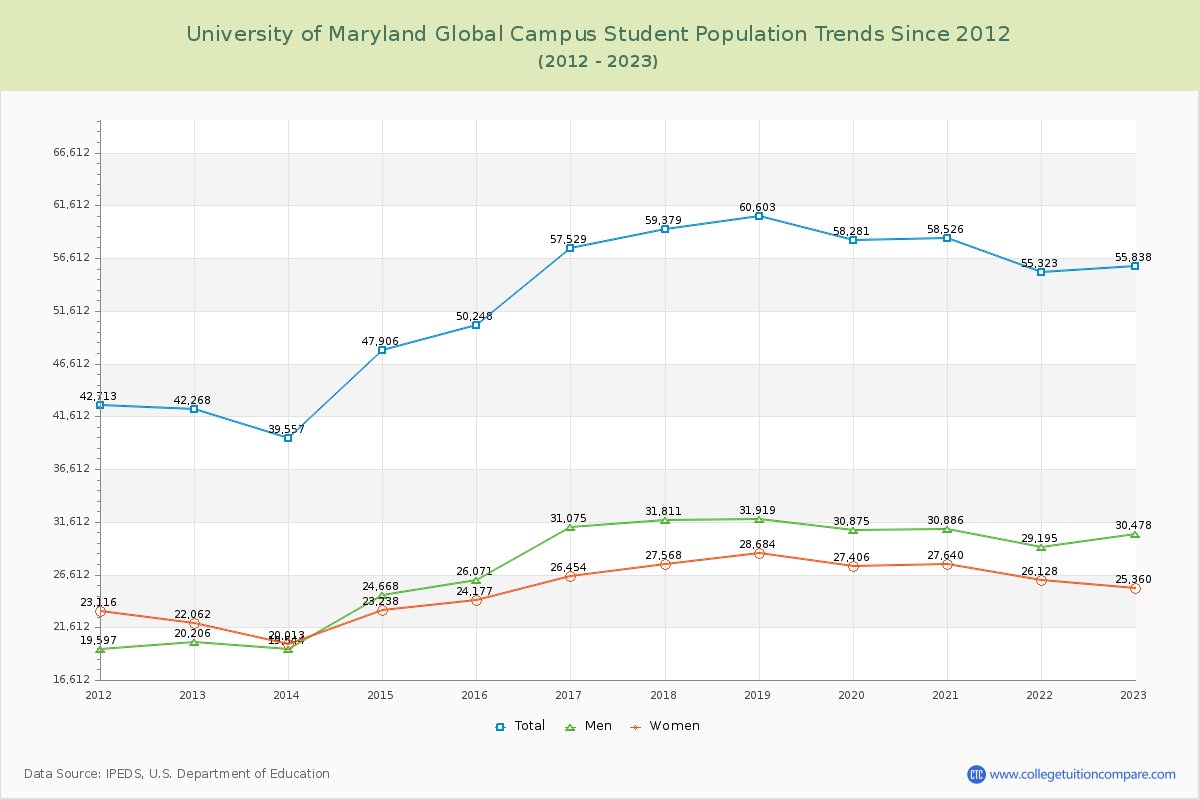
Student Population Changes
The average student population over the last 12 years is 53,223 where 55,838 students are attending the school for the academic year 2022-2023.
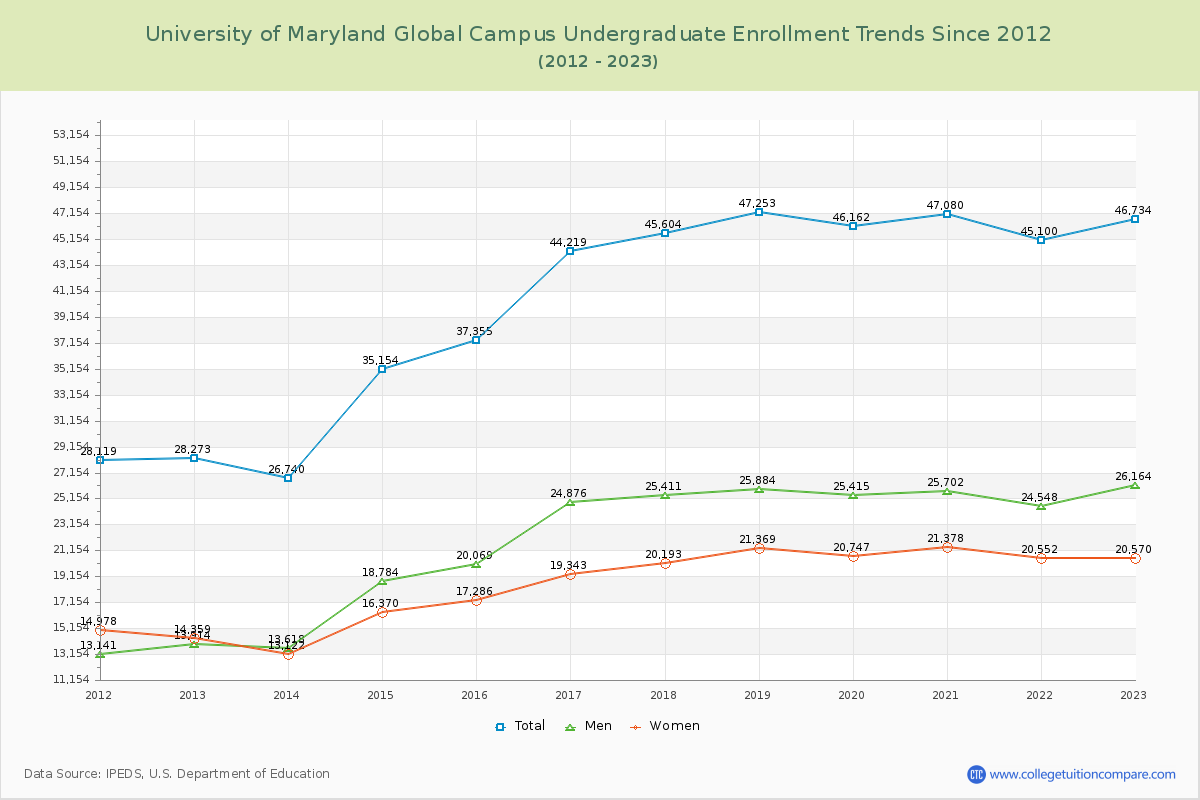
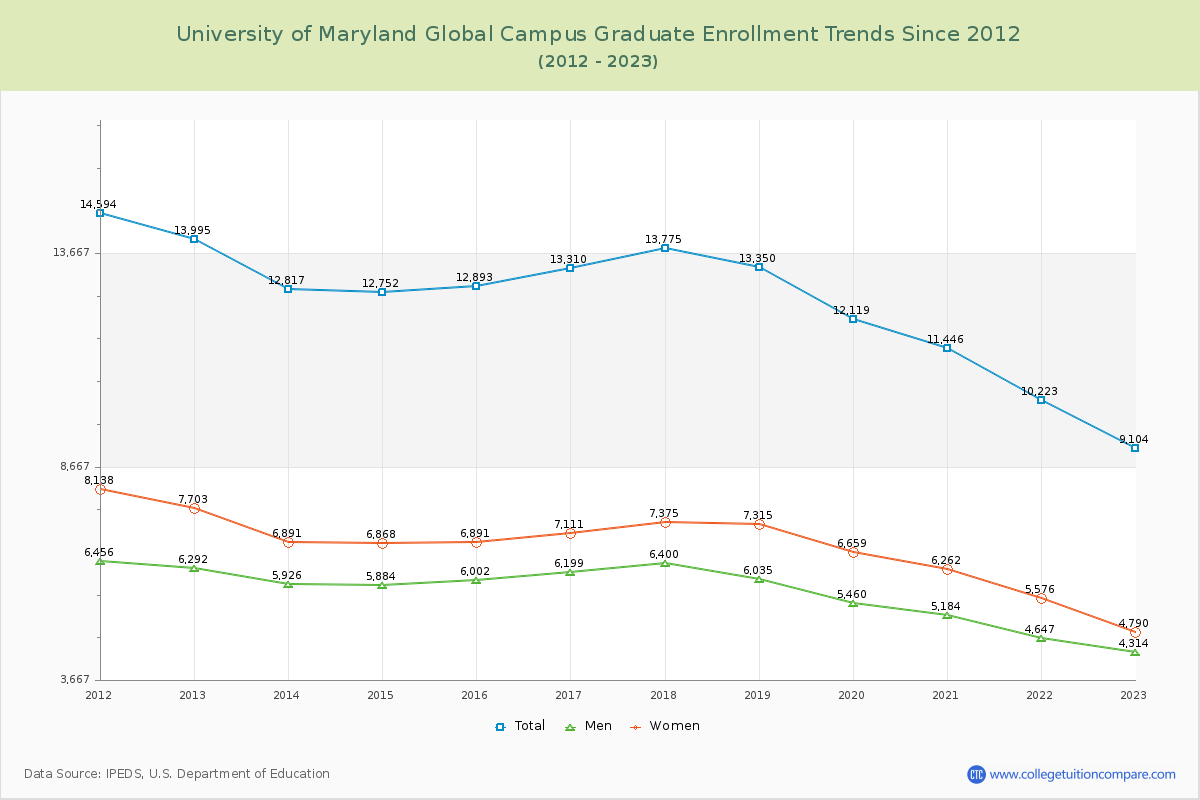
83.70% of total students is undergraduate students and 16.30% students is graduate students. The number of undergraduate students has increased by 18,461 and the graduate enrollment has decreased by 4,891 over past 10 years.
The female to male ratio is 0.83 to 1 and it means that there are slightly more male students enrolled in UMUC than female students.
The following table and chart illustrate the changes in student population by gender at University of Maryland Global Campus since 2012.
| Year | Total | Undergraduate | Graduate | ||||
|---|---|---|---|---|---|---|---|
| Total | Men | Women | Total | Men | Women | ||
| 2012-13 | 42,268 | 28,273 | 13,914 | 14,359 | 13,995 | 6,292 | 7,703 |
| 2013-14 | 39,557 -2,711 | 26,740 -1,533 | 13,618 -296 | 13,122 -1,237 | 12,817 -1,178 | 5,926 -366 | 6,891 -812 |
| 2014-15 | 47,906 8,349 | 35,154 8,414 | 18,784 5,166 | 16,370 3,248 | 12,752 -65 | 5,884 -42 | 6,868 -23 |
| 2015-16 | 50,248 2,342 | 37,355 2,201 | 20,069 1,285 | 17,286 916 | 12,893 141 | 6,002 118 | 6,891 23 |
| 2016-17 | 57,529 7,281 | 44,219 6,864 | 24,876 4,807 | 19,343 2,057 | 13,310 417 | 6,199 197 | 7,111 220 |
| 2017-18 | 59,379 1,850 | 45,604 1,385 | 25,411 535 | 20,193 850 | 13,775 465 | 6,400 201 | 7,375 264 |
| 2018-19 | 60,603 1,224 | 47,253 1,649 | 25,884 473 | 21,369 1,176 | 13,350 -425 | 6,035 -365 | 7,315 -60 |
| 2019-20 | 58,281 -2,322 | 46,162 -1,091 | 25,415 -469 | 20,747 -622 | 12,119 -1,231 | 5,460 -575 | 6,659 -656 |
| 2020-21 | 58,526 245 | 47,080 918 | 25,702 287 | 21,378 631 | 11,446 -673 | 5,184 -276 | 6,262 -397 |
| 2021-22 | 55,323 -3,203 | 45,100 -1,980 | 24,548 -1,154 | 20,552 -826 | 10,223 -1,223 | 4,647 -537 | 5,576 -686 |
| 2022-23 | 55,838 515 | 46,734 1,634 | 26,164 1,616 | 20,570 18 | 9,104 -1,119 | 4,314 -333 | 4,790 -786 |
| Average | 53,223 | 40,879 | 22,217 | 18,663 | 12,344 | 5,668 | 6,676 |