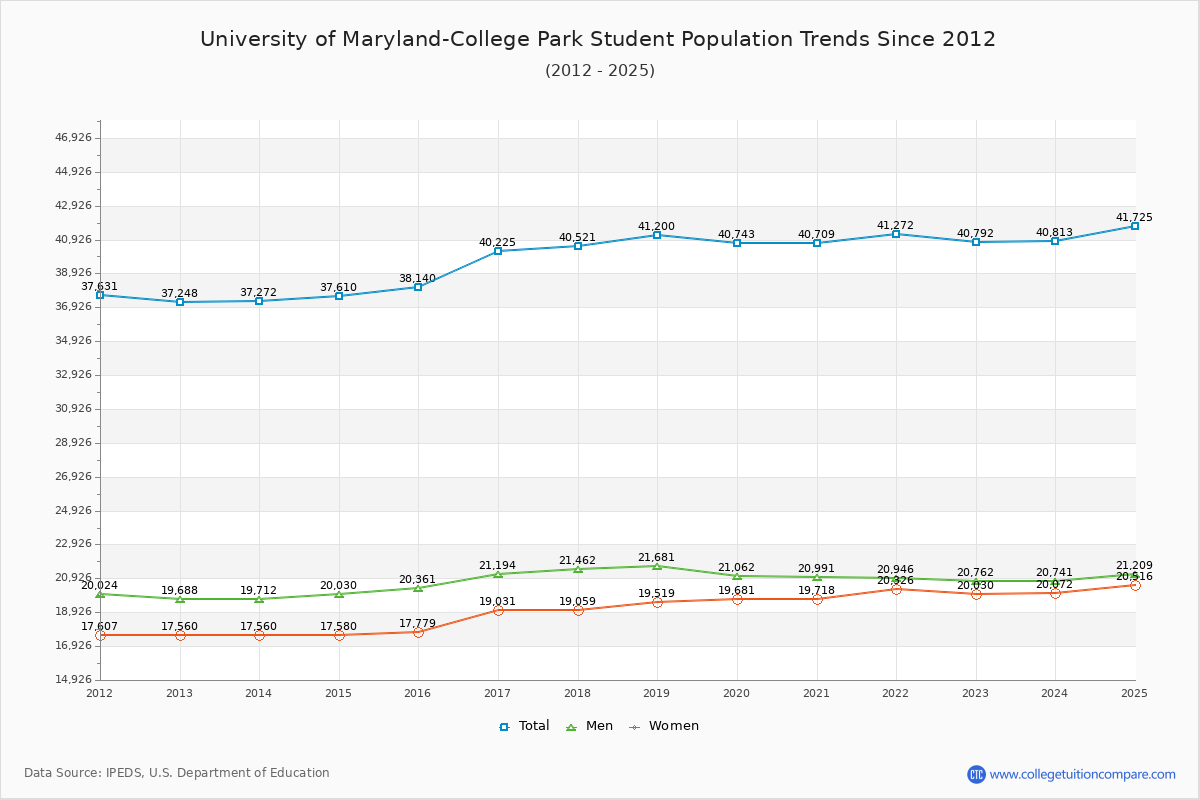
Student Population Changes
The average student population over the last 12 years is 39,612 where 40,792 students are attending the school for the academic year 2022-2023.
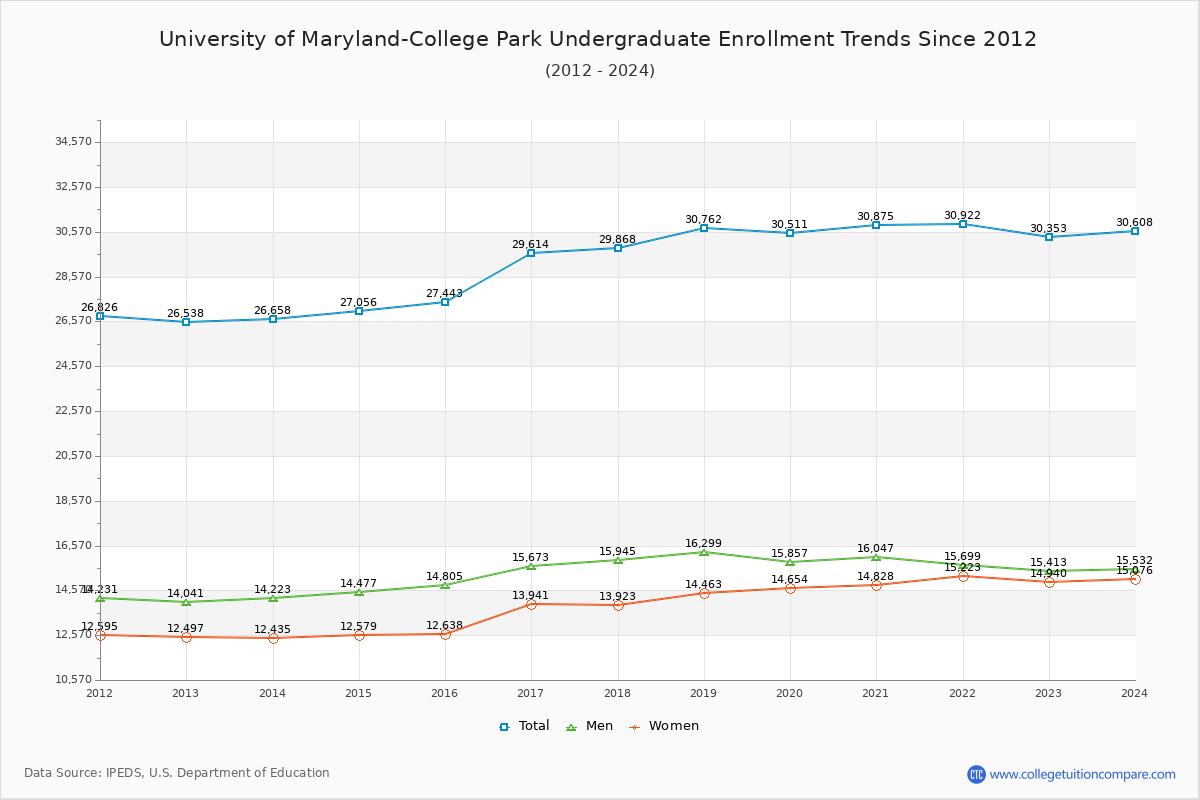
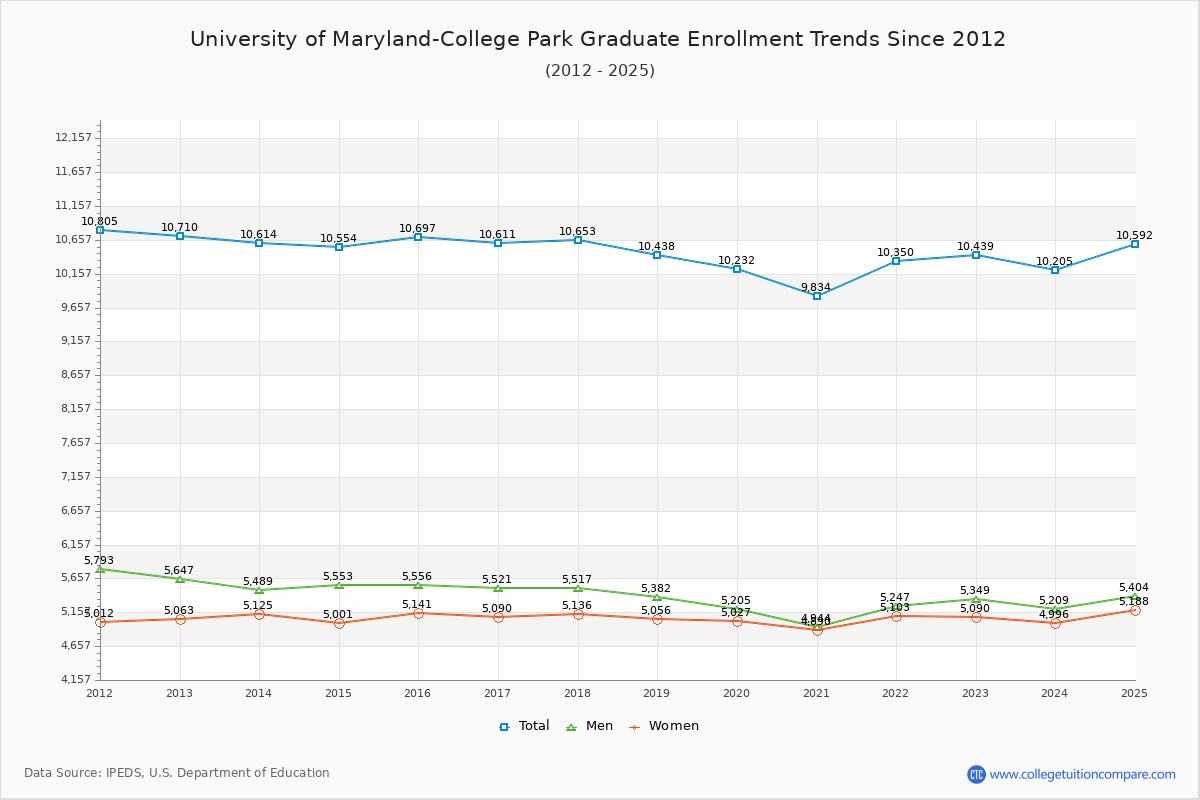
74.41% of total students is undergraduate students and 25.59% students is graduate students. The number of undergraduate students has increased by 3,815 and the graduate enrollment has decreased by 271 over past 10 years.
The female to male ratio is 0.96 to 1 and it means that there are similar numbers of female and male students enrolled in UMD.
The following table and chart illustrate the changes in student population by gender at University of Maryland-College Park since 2012.
| Year | Total | Undergraduate | Graduate | ||||
|---|---|---|---|---|---|---|---|
| Total | Men | Women | Total | Men | Women | ||
| 2012-13 | 37,248 | 26,538 | 14,041 | 12,497 | 10,710 | 5,647 | 5,063 |
| 2013-14 | 37,272 24 | 26,658 120 | 14,223 182 | 12,435 -62 | 10,614 -96 | 5,489 -158 | 5,125 62 |
| 2014-15 | 37,610 338 | 27,056 398 | 14,477 254 | 12,579 144 | 10,554 -60 | 5,553 64 | 5,001 -124 |
| 2015-16 | 38,140 530 | 27,443 387 | 14,805 328 | 12,638 59 | 10,697 143 | 5,556 3 | 5,141 140 |
| 2016-17 | 40,225 2,085 | 29,614 2,171 | 15,673 868 | 13,941 1,303 | 10,611 -86 | 5,521 -35 | 5,090 -51 |
| 2017-18 | 40,521 296 | 29,868 254 | 15,945 272 | 13,923 -18 | 10,653 42 | 5,517 -4 | 5,136 46 |
| 2018-19 | 41,200 679 | 30,762 894 | 16,299 354 | 14,463 540 | 10,438 -215 | 5,382 -135 | 5,056 -80 |
| 2019-20 | 40,743 -457 | 30,511 -251 | 15,857 -442 | 14,654 191 | 10,232 -206 | 5,205 -177 | 5,027 -29 |
| 2020-21 | 40,709 -34 | 30,875 364 | 16,047 190 | 14,828 174 | 9,834 -398 | 4,944 -261 | 4,890 -137 |
| 2021-22 | 41,272 563 | 30,922 47 | 15,699 -348 | 15,223 395 | 10,350 516 | 5,247 303 | 5,103 213 |
| 2022-23 | 40,792 -480 | 30,353 -569 | 15,413 -286 | 14,940 -283 | 10,439 89 | 5,349 102 | 5,090 -13 |
| Average | 39,612 | 29,145 | 15,316 | 13,829 | 10,467 | 5,401 | 5,066 |