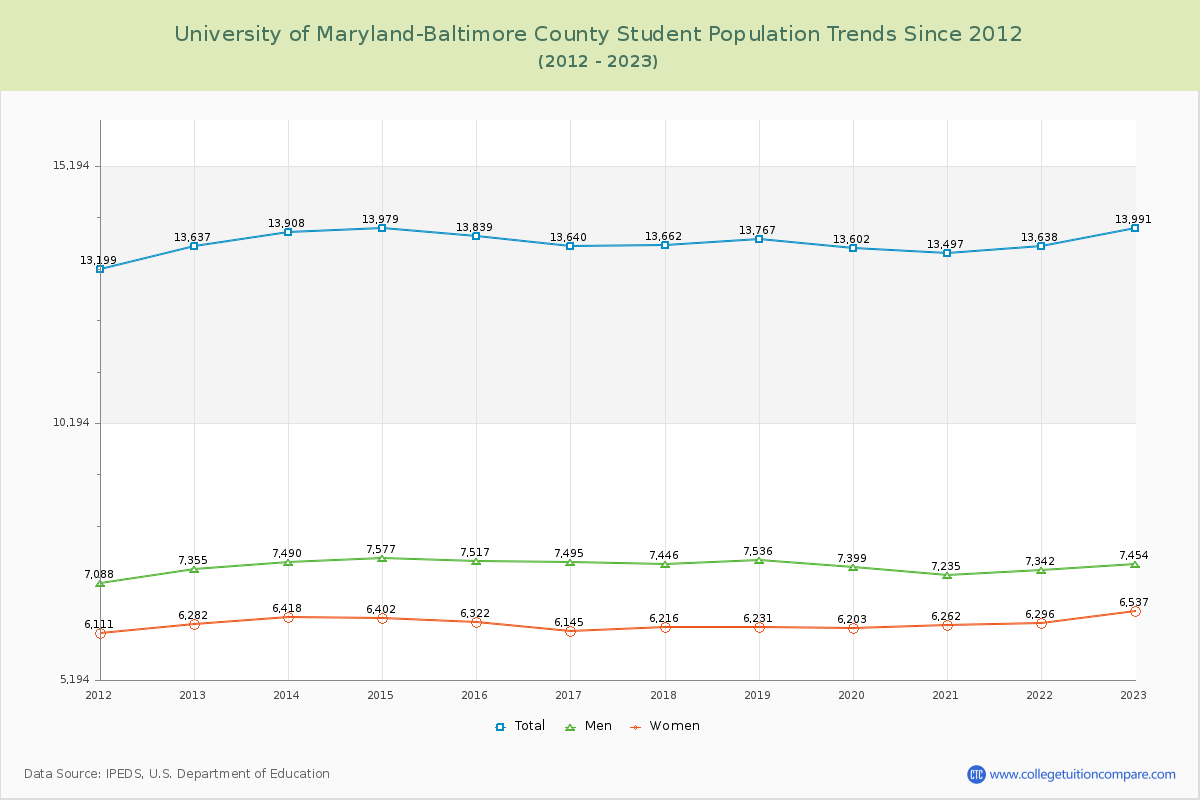
Student Population Changes
The average student population over the last 12 years is 13,742 where 13,991 students are attending the school for the academic year 2022-2023.
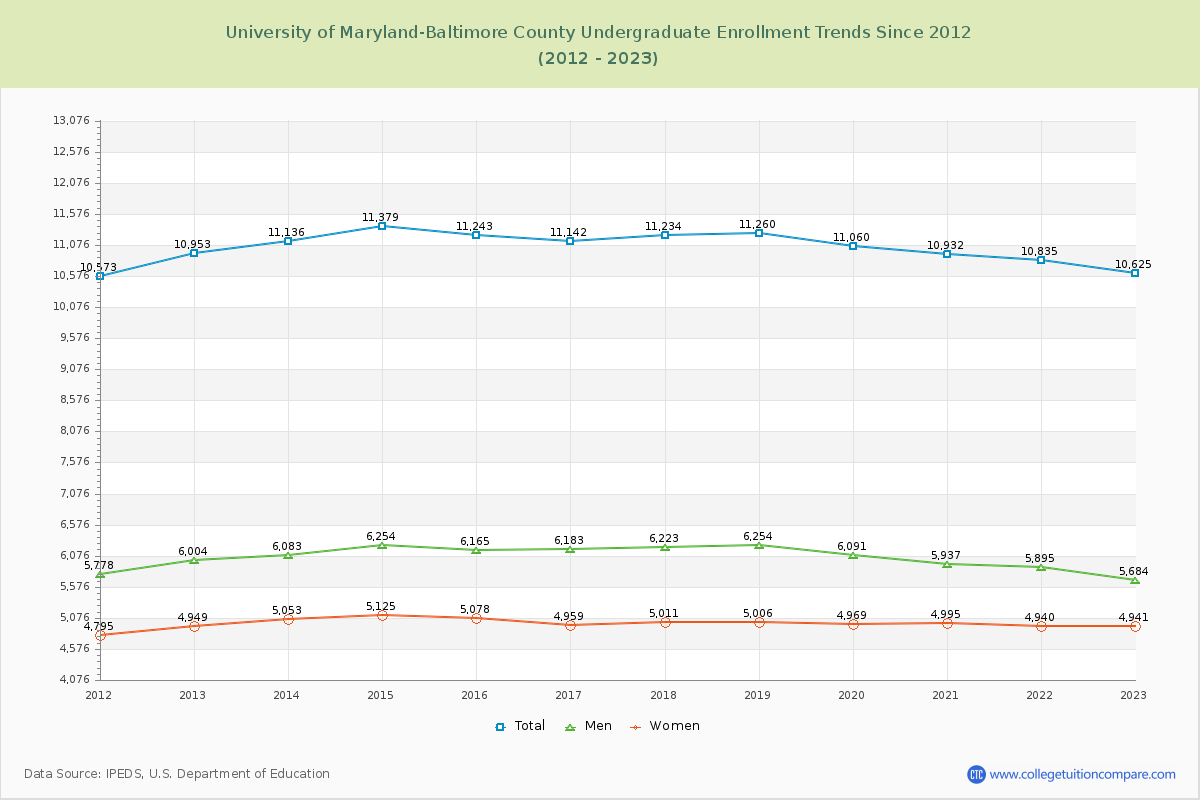
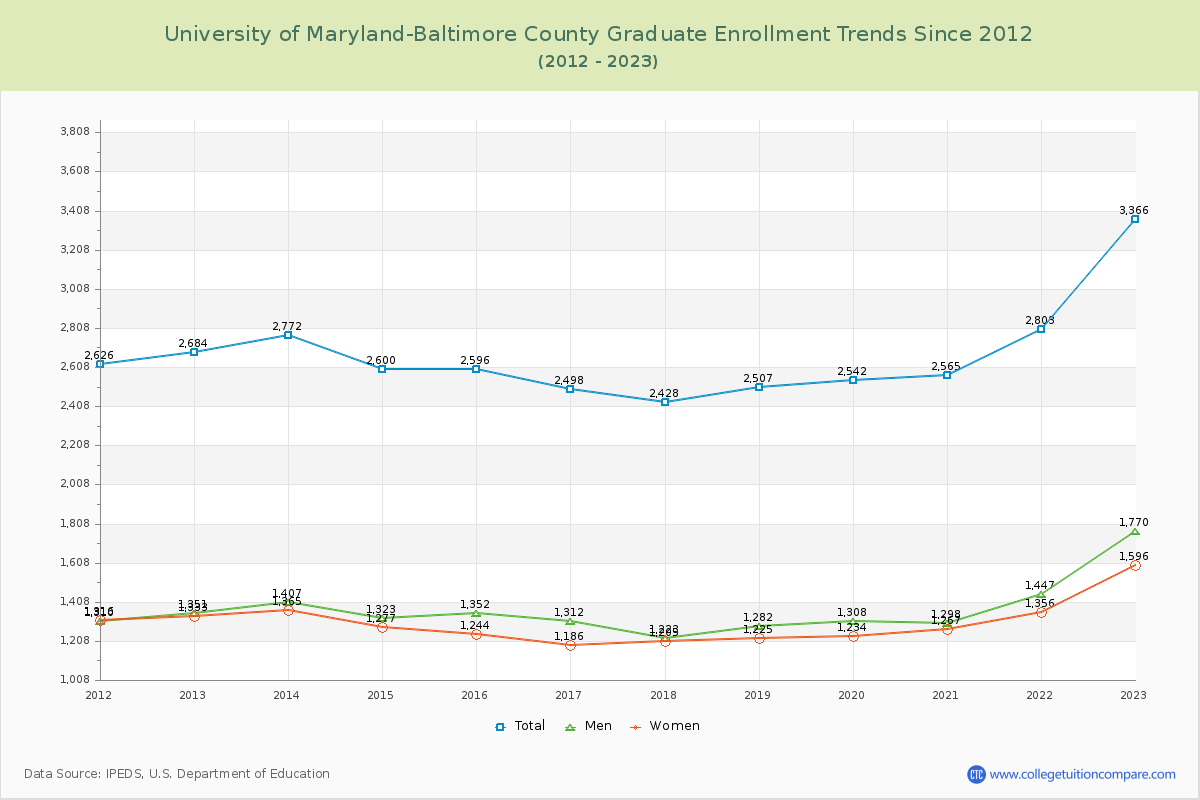
75.94% of total students is undergraduate students and 24.06% students is graduate students. The number of undergraduate students has decreased by 328 and the graduate enrollment has increased by 682 over past 10 years.
The female to male ratio is 0.88 to 1 and it means that there are slightly more male students enrolled in UMBC than female students.
The following table and chart illustrate the changes in student population by gender at University of Maryland-Baltimore County since 2012.
| Year | Total | Undergraduate | Graduate | ||||
|---|---|---|---|---|---|---|---|
| Total | Men | Women | Total | Men | Women | ||
| 2012-13 | 13,637 | 10,953 | 6,004 | 4,949 | 2,684 | 1,351 | 1,333 |
| 2013-14 | 13,908 271 | 11,136 183 | 6,083 79 | 5,053 104 | 2,772 88 | 1,407 56 | 1,365 32 |
| 2014-15 | 13,979 71 | 11,379 243 | 6,254 171 | 5,125 72 | 2,600 -172 | 1,323 -84 | 1,277 -88 |
| 2015-16 | 13,839 -140 | 11,243 -136 | 6,165 -89 | 5,078 -47 | 2,596 -4 | 1,352 29 | 1,244 -33 |
| 2016-17 | 13,640 -199 | 11,142 -101 | 6,183 18 | 4,959 -119 | 2,498 -98 | 1,312 -40 | 1,186 -58 |
| 2017-18 | 13,662 22 | 11,234 92 | 6,223 40 | 5,011 52 | 2,428 -70 | 1,223 -89 | 1,205 19 |
| 2018-19 | 13,767 105 | 11,260 26 | 6,254 31 | 5,006 -5 | 2,507 79 | 1,282 59 | 1,225 20 |
| 2019-20 | 13,602 -165 | 11,060 -200 | 6,091 -163 | 4,969 -37 | 2,542 35 | 1,308 26 | 1,234 9 |
| 2020-21 | 13,497 -105 | 10,932 -128 | 5,937 -154 | 4,995 26 | 2,565 23 | 1,298 -10 | 1,267 33 |
| 2021-22 | 13,638 141 | 10,835 -97 | 5,895 -42 | 4,940 -55 | 2,803 238 | 1,447 149 | 1,356 89 |
| 2022-23 | 13,991 353 | 10,625 -210 | 5,684 -211 | 4,941 1 | 3,366 563 | 1,770 323 | 1,596 240 |
| Average | 13,742 | 11,073 | 6,070 | 5,002 | 2,669 | 1,370 | 1,299 |